

Association mapping of loci controlling genetic and environmental interaction of soybean flowering time under various photo-thermal conditions
- PMID: 28549456
- PMCID: PMC5446728
- DOI: 10.1186/s12864-017-3778-3
Association mapping of loci controlling genetic and environmental interaction of soybean flowering time under various photo-thermal conditions
Abstract
Background: Soybean (Glycine max (L.) Merr.) is a short day plant. Its flowering and maturity time are controlled by genetic and environmental factors, as well the interaction between the two factors. Previous studies have shown that both genetic and environmental factors, mainly photoperiod and temperature, control flowering time of soybean. Additionally, these studies have reported gene × gene and gene × environment interactions on flowering time. However, the effects of quantitative trait loci (QTL) in response to photoperiod and temperature have not been well evaluated. The objectives of the current study were to identify the effects of loci associated with flowering time under different photo-thermal conditions and to understand the effects of interaction between loci and environment on soybean flowering.
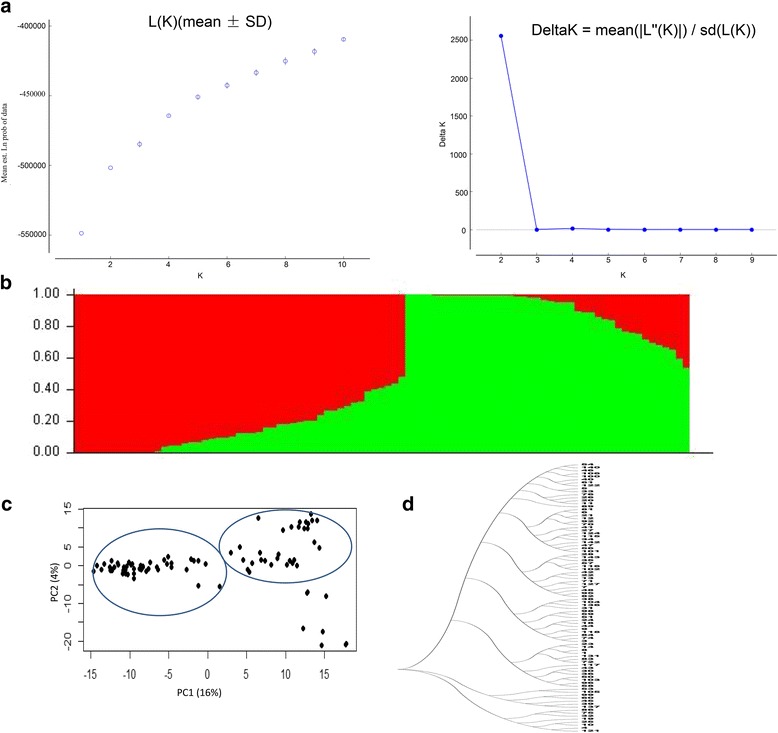
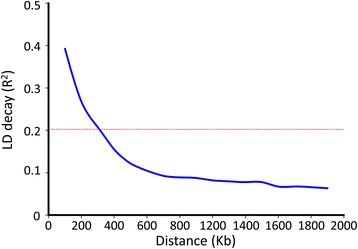
Methods: Different photoperiod and temperature combinations were obtained by adjusting sowing dates (spring sowing and summer sowing) or day-length (12 h, 16 h). Association mapping was performed on 91 soybean cultivars from different maturity groups (MG000-VIII) using 172 SSR markers and 5107 SNPs from the Illumina SoySNP6K iSelectBeadChip. The effects of the interaction between QTL and environments on flowering time were also analysed using the QTXNetwork.
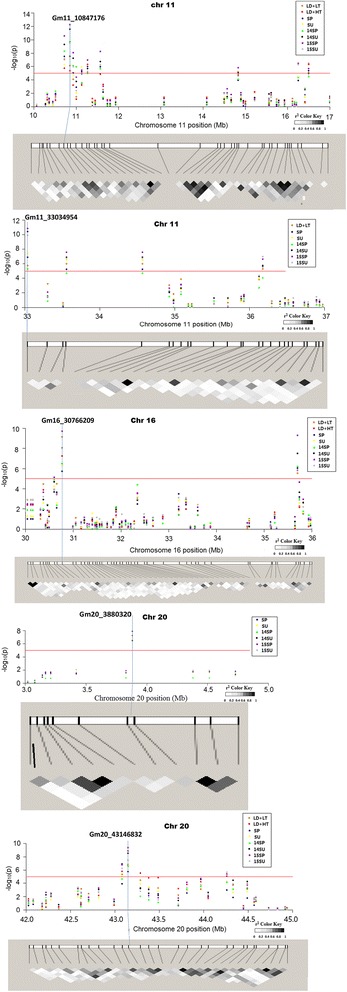
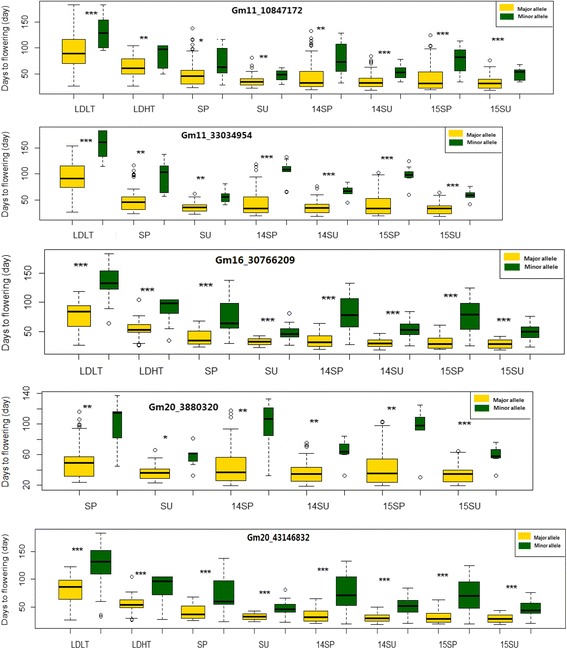
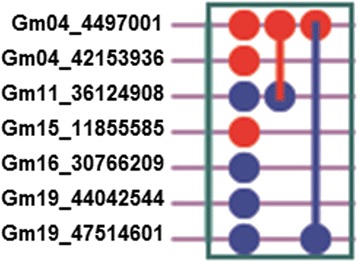
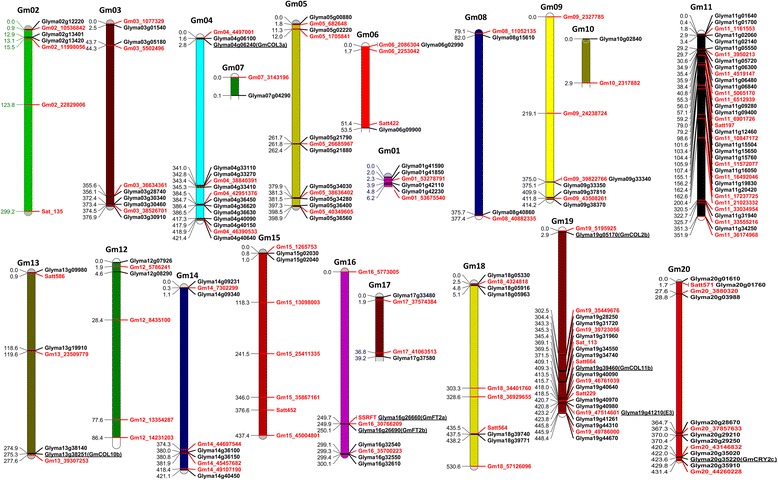
Results: Large-effect loci were detected on Gm 11, Gm 16 and Gm 20 as in previous reports. Most loci associated with flowering time are sensitive to photo-thermal conditions. Number of loci associated with flowering time was more under the long day (LD) than under the short day (SD) condition. The variation of flowering time among the soybean cultivars mostly resulted from the epistasis × environment and additive × environment interactions. Among the three candidate loci, i.e. Gm04_4497001 (near GmCOL3a), Gm16_30766209 (near GmFT2a and GmFT2b) and Gm19_47514601 (E3 or GmPhyA3), the Gm04_4497001 may be the key locus interacting with other loci for controlling soybean flowering time.
Conclusion: The effects of loci associated with the flowering time of soybean were dependent upon the photo-thermal conditions. This study facilitates the understanding of the genetic mechanism of soybean flowering and molecular breeding for the improvement of soybean adaptability to specific and/or broad regions.
Keywords: Flowering time; Gene by environment interaction; Genetic architecture; Photo-thermal condition; Soybean (Glycine max).
Figures
References
-
- Cober ER, Tanner JW, Voldeng HD. Genetic control of photoperiod response in early-maturing, near-isogenic soybean lines. Crop Sci. 1996;36(3):601–605. doi: 10.2135/cropsci1996.0011183X003600030013x. - DOI
-
- Major D, Johnson D, Tanner J, Anderson I. Effects of daylength and temperature on soybean development. Crop Sci. 1975;15(2):174–179. doi: 10.2135/cropsci1975.0011183X001500020009x. - DOI
-
- Zhang L, Wang R, Hesketh JD. Effects of photoperiod on growth and development of soybean floral bud in different maturity. Agron J. 2001;93(4):944–948. doi: 10.2134/agronj2001.934944x. - DOI
-
- Benitez ER, Funatsuki H, Kaneko Y, Matsuzawa Y, Bang SW, Takahashi R. Soybean maturity gene effects on seed coat pigmentation and cracking in response to low temperatures. Crop Sci. 2004;44(6):2038–2042. doi: 10.2135/cropsci2004.2038. - DOI
-
- Cooper RL. A delayed flowering barrier to higher soybean yields. Field Crop Res. 2003;82(1):27–35. doi: 10.1016/S0378-4290(03)00003-0. - DOI
Publication types
MeSH terms
LinkOut - more resources
Full Text Sources
Other Literature Sources
Research Materials
