. 2017 Sep 5:452:93-109.
doi: 10.1016/j.mce.2017.05.018. Epub 2017 May 23.

Early transcriptome responses of the bovine midcycle corpus luteum to prostaglandin F2α includes cytokine signaling

Affiliations

Early transcriptome responses of the bovine midcycle corpus luteum to prostaglandin F2α includes cytokine signaling

Heather Talbott et al. Mol Cell Endocrinol. .

Abstract

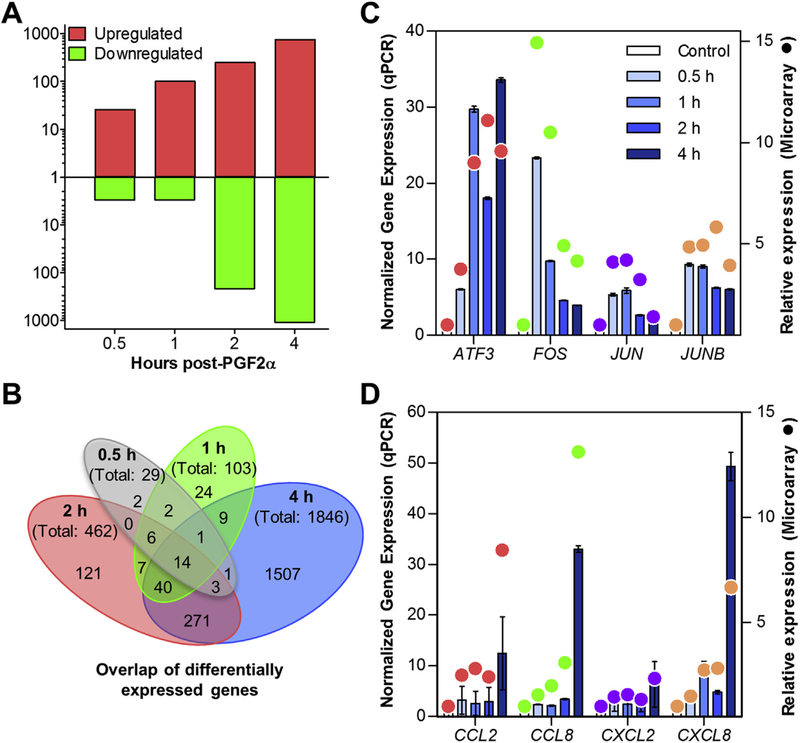
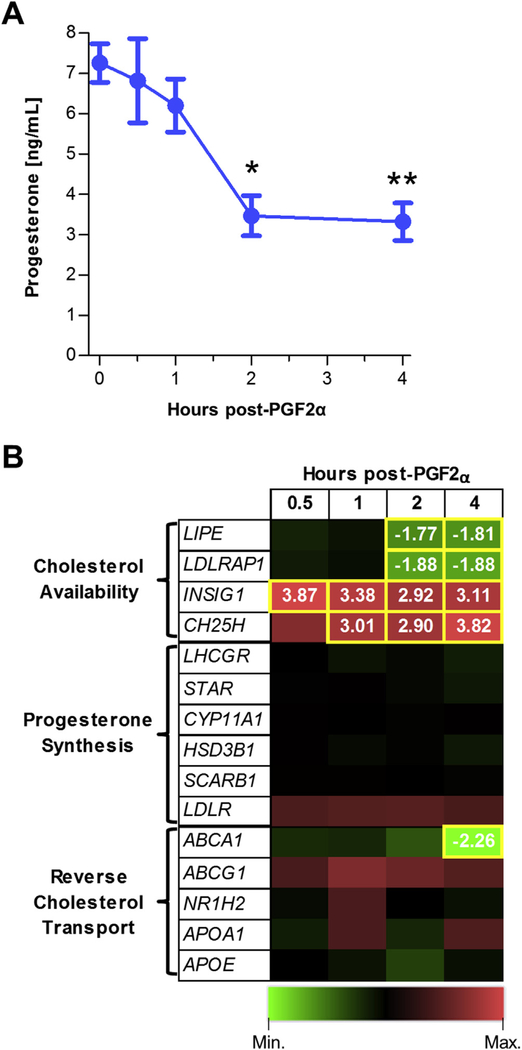
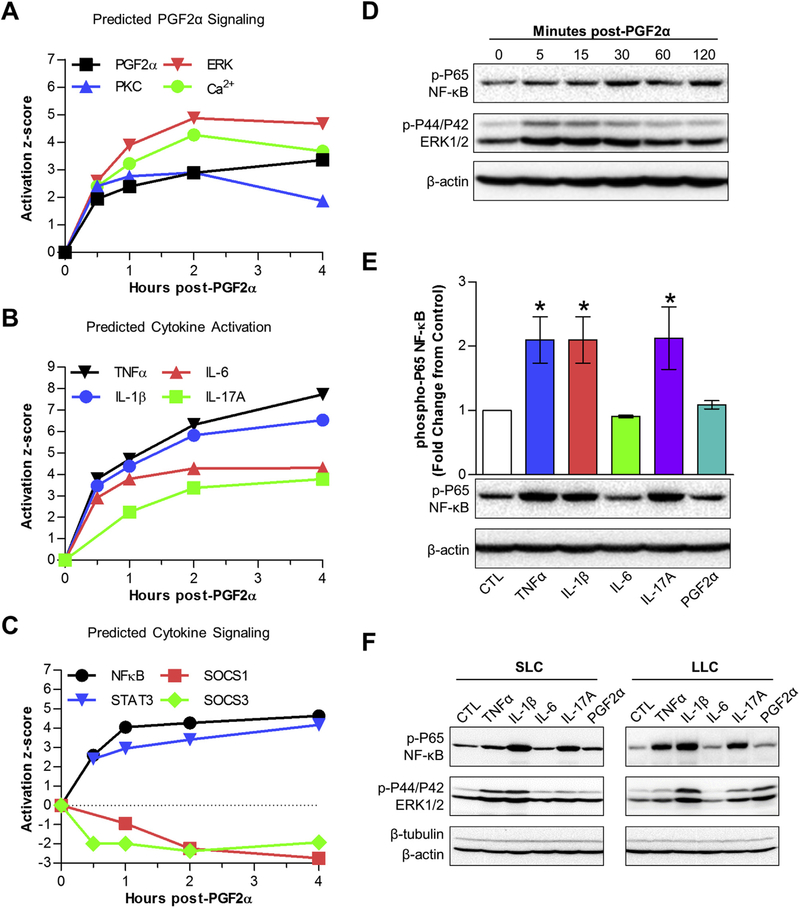
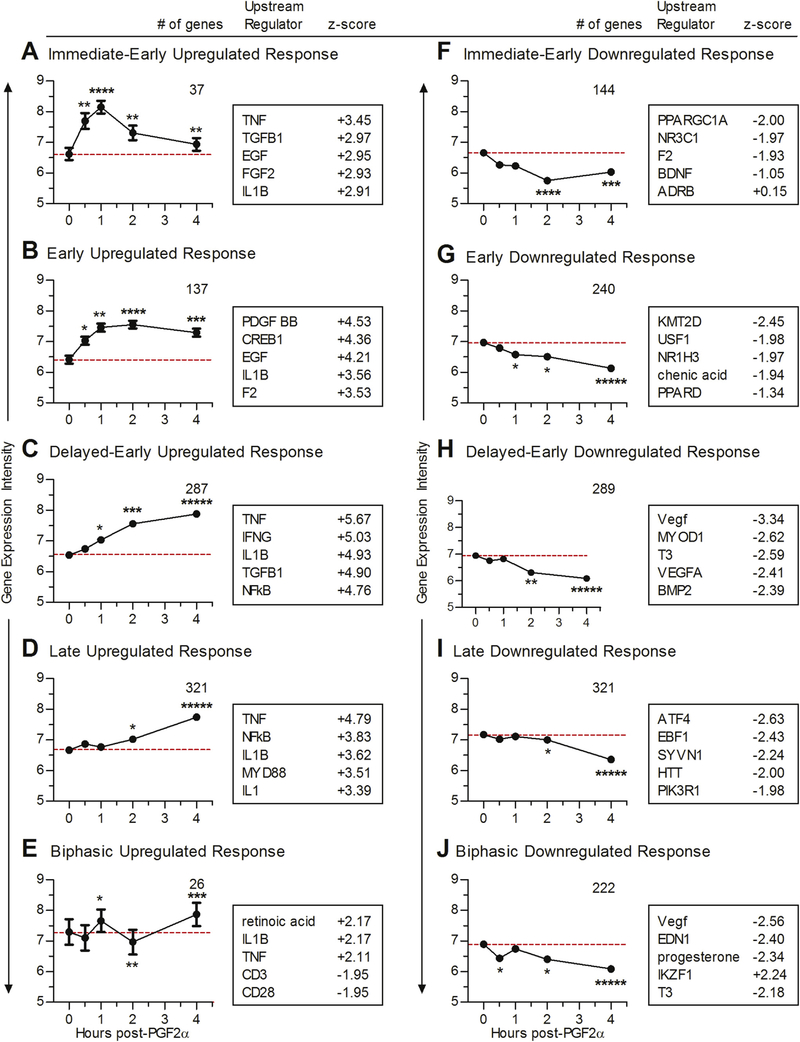
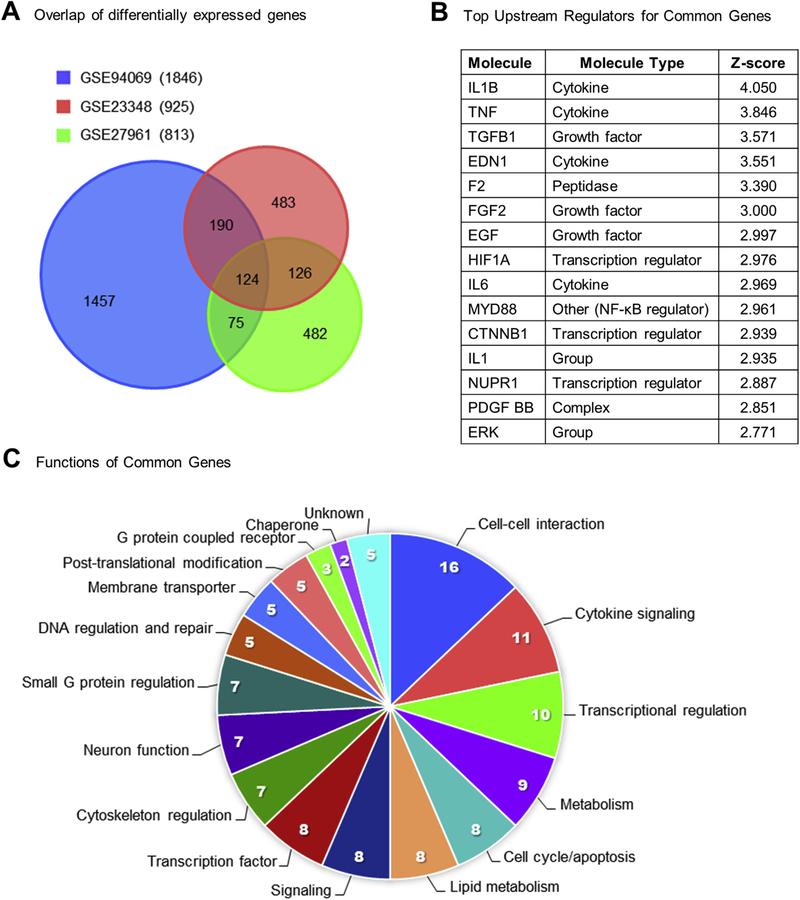
In ruminants, prostaglandin F2alpha (PGF2α)-mediated luteolysis is essential prior to estrous cycle resumption, and is a target for improving fertility. To deduce early PGF2α-provoked changes in the corpus luteum a short time-course (0.5-4 h) was performed on cows at midcycle. A microarray-determined transcriptome was established and examined by bioinformatic pathway analysis. Classic PGF2α effects were evident by changes in early response genes (FOS, JUN, ATF3) and prediction of active pathways (PKC, MAPK). Several cytokine transcripts were elevated and NF-κB and STAT activation were predicted by pathway analysis. Self-organizing map analysis grouped differentially expressed transcripts into ten mRNA expression patterns indicative of temporal signaling cascades. Comparison with two analogous datasets revealed a conserved group of 124 transcripts similarly altered by PGF2α treatment, which both, directly and indirectly, indicated cytokine activation. Elevated levels of cytokine transcripts after PGF2α and predicted activation of cytokine pathways implicate inflammatory reactions early in PGF2α-mediated luteolysis.

Keywords: Corpus luteum; Cytokine; Luteolysis; PGF2α; Regression; Signaling.


Figures

Fig. 1.
Fig. 1.. Time-course of the transcriptomic response to PGF2α.
Midcycle cows (n = 3/time-point) were treated with 25 μg PGF2α for ≥ |0.5|, 1, 2, and 4 h and control saline injections (n = 3). Samples were analyzed by Affymetrix bovine whole transcript microarray (Bovine Gene v1 Array [BovGene-1_0-v1]; GPL17645) and differentially expressed transcripts were identified based on fold change 1.5j and Benjamini-Hochberg adjusted P-value ≤ 0.05 compared to saline controls (n = 3). (A) Number of upregulated and downregulated differentially expressed transcripts at each time-point graphed on a log scale, upregulated transcripts appear in red above the central axis, and downregulated transcripts appear in green below the axis. (B) Venn diagram of the number of differentially expressed genes that overlapped between the four times examined. Each oval is labeled with the time-point and the total number of differentially expressed genes in the time-point. Overlapping parts of the ovals are labeled with the number of transcripts that were differentially expressed at the corresponding times. (C & D). Quantitative PCR (qPCR) analysis of target genes normalized to ACTB and GAPDH expression and compared to saline controls using fold-change are displayed using bar graphs to represent mean ± SEM and plotted on the left Y-axis. Microarray determined fold-change of the target genes compared to control are overlayed using filled circles • to represent the mean (n = 3) and plotted on the right Y-axis. (C) Selected transcription factor genes (ATF3, FOS, JUN, and JUNB) were significantly different from control values (P < 0.0001) as determined by qPCR and determined as differentially expressed in the microarray (except JUN at 4 h). (D). Target chemokine transcripts (CCL2, CCL8, CXCL2, and CXCL8) were all upregulated at 4 h (P < 0.01). Additionally, CXCL8 was significantly upregulated at 1 and 2 h (P < 0.0001, P < 0.05, respectively) as determined by qPCR. Determination of differentially expressed transcripts by microarray indicated significant upregulation of CXCL2 and CXCL8 at 4 h and CCL8 at both 2 and 4 h. (For interpretation of the references to colour in this figure legend, the reader is referred to the web version of this article.)
Fig. 2.
Fig. 2.. PGF2α induced reductions in serum progesterone are correlated with reductions in the expression of genes that control intracellular cholesterol availability.
(A) Serum progesterone concentrations of cows 0.5–4 h after PGF2α treatment (n = 3/time-point). *P ≤ 0.05, **P ≤ 0.01 compared to saline-treated animals. (B) Heat map of genes that regulate cholesterol availability, progesterone synthesis, and reverse cholesterol transport. Green indicates decreased and red indicates increased transcripts over control. Yellow boxes indicate times that were significantly altered from saline controls and fold changes from saline controls are indicated in the respective boxes. (For interpretation of the references to colour in this figure legend, the reader is referred to the web version of this article.)
Fig. 3.
Fig. 3.. In vivo treatment with PGF2α predicts classical PGF2α and cytokine signaling.
(A, B & C) The activation z-score of specific upstream regulators, determined by IPA, graphed against time. (A) Classic mediators of PGF2α signaling including, PGF2α itself (dinoprost, black), protein kinase C (PKC group, blue), ERK (red), and Ca2+ (green). (B) Cytokine activation scores including, TNFα (black), IL-1β (blue), IL-6 (red), and IL-17 (green). (C) Cytokine signaling molecules: NF-kB (black), STAT3 (blue), and suppressors of cytokine signaling, SOCS1 (red) and SOCS3 (green). (D) Phospho-P65 quantification (mean ± SEM) of non-pregnant midcycle luteal cells (n = 3) treated with TNFα, IL-1β, IL-17A and PGF2α for 30 min followed by Western blot analysis, normalized to β-actin and compared to untreated controls, representative immunoblots are shown below the bar graph. *P ≤ 0.05 compared to control. (E) Western blot of non-pregnant midcycle luteal cells treated with PGF2α for the indicated times immunoblotted for phospho-P65, phospho-ERK½, β-tubulin, and β-actin. (F) Western blot of small luteal cells (SLC) and large luteal cells (LLC) treated with TNFα, IL-1β, IL-6, IL-17A (10 ng/mL each) and PGF2α (100 nM) for 30 min and immunoblotted for phospho-P65, phospho-ERK½, β-tubulin, and β-actin. (For interpretation of the references to colour in this figure legend, the reader is referred to the web version of this article.)
Fig. 4.
Fig. 4.. Temporal response waves to PGF2α.
2Self-organizing maps (SOMs) graphs were generated as detailed in Methods. Each graph shows the average log2 transcript expression intensity ± SEM of the transcripts grouped into each SOM. Red dashed lines demonstrate the average transcript expression intensity at baseline. Numbers in the upper right of the individual graphs represent the number of transcripts within each SOM. Groups of transcripts that were upregulated during the PGF2α time-course are shown on the left (A, B, C, D, & E) and downregulated transcripts on the right (F, G, H, I, & J). (A & F) SOMs showed responses typical of immediate-early response genes, peaked between 1 and 2 h and returned to baseline. (B & G) SOMs demonstrated early response genes, peaked at 2 h and maintained through the 4-h time-point. (C & H) SOMs demonstrated delayed-early response genes, which gradually moved away from baseline throughout the time-course. (D & I) SOMs showed late-response genes, which stayed near the baseline and then began changing at 2–4 h (E & J) Biphasic SOMs, which had an early change in transcript expression, returned to baseline and then had a second change in transcription levels. Boxes to the right of the graphs include the top upstream regulators predicted to be involved using IPA at the peak of change from controls, along with their corresponding IPA determined activation z-score. Data points in each SOM are labeled to indicate the percentage of transcripts that are differentially expressed at each time-point: ***** 99–100%; **** 76–98%; *** 51–75%, ** 26–50%, * 1–25%. (For interpretation of the references to colour in this figure legend, the reader is referred to the web version of this article.)
Fig. 5.
Fig. 5.. Common gene alterations in response to PGF2α.
(A) Venn diagrams demonstrate the number of differentially expressed genes that overlapped between the three examined datasets GSE94069 (blue, Talbott et al., 2017), GSE23348 (red, Mondal et al., 2011), and GSE27961 (green, Shah et al., 2014). The legend indicates the numbers of total differentially expressed genes in parentheses for each dataset. Overlapping parts of the circles are labeled with the corresponding number of transcripts that are differentially expressed in that situation. (B) The top 15 IPA-predicted upstream regulators based on the 124 common genes with corresponding IPA molecule type designations and z-scores. (C) Functional categorization of the 124 common genes common to all three datasets, sections are labeled with both the category and the number of genes in each category. (For interpretation of the references to colour in this figure legend, the reader is referred to the web version of this article.)

Similar articles

Cited by

References

    1. Aboelenain M, Kawahara M, Balboula AZ, Montasser AE-M, Zaabel SM, Okuda K, Takahashi M, 2015. Status of autophagy, lysosome activity and apoptosis during corpus luteum regression in cattle. J. Reprod. Dev 61, 229–236. 10.1262/jrd.2014-135. - DOI - PMC - PubMed
    1. Acosta TJ, Yoshizawa N, Ohtani M, Miyamoto A, 2002. Local changes in blood flow within the early and midcycle corpus luteum after prostaglandin F(2 alpha) injection in the cow. Biol. Reprod 66, 651–658. - PubMed
    1. Arts RJW, Joosten LAB, van der Meer JWM, Netea MG, 2013. TREM-1: intracellular signaling pathways and interaction with pattern recognition receptors. J. Leukoc. Biol 93, 209–215. 10.1189/jlb.0312145. - DOI - PubMed
    1. Arvisais E, Hou X, Wyatt TA, Shirasuna K, Bollwein H, Miyamoto A, Hansen TR, Rueda BR, Davis JS, 2010. Prostaglandin F2alpha represses IGF-I-stimulated IRS1/phosphatidylinositol-3-kinase/AKT signaling in the corpus luteum: role of ERK and P70 ribosomal S6 kinase. Mol. Endocrinol. 24, 632–643. 10.1210/me.2009-0312. - DOI - PMC - PubMed
    1. Atli MO, Bender RW, Mehta V, Bastos MR, Luo W, Vezina CM, Wiltbank MC, 2012. Patterns of gene expression in the bovine corpus luteum following repeated intrauterine infusions of low doses of prostaglandin F2alpha . Biol. Reprod. 86, 130 10.1095/biolreprod.111.094870. - DOI - PMC - PubMed

Publication types

MeSH terms