. 2017 Aug;206(4):2105-2117.
doi: 10.1534/genetics.116.199190. Epub 2017 May 26.

Distributions of Mutational Effects and the Estimation of Directional Selection in Divergent Lineages of Arabidopsis thaliana

Affiliations

Distributions of Mutational Effects and the Estimation of Directional Selection in Divergent Lineages of Arabidopsis thaliana

Briton Park et al. Genetics. 2017 Aug.

Abstract

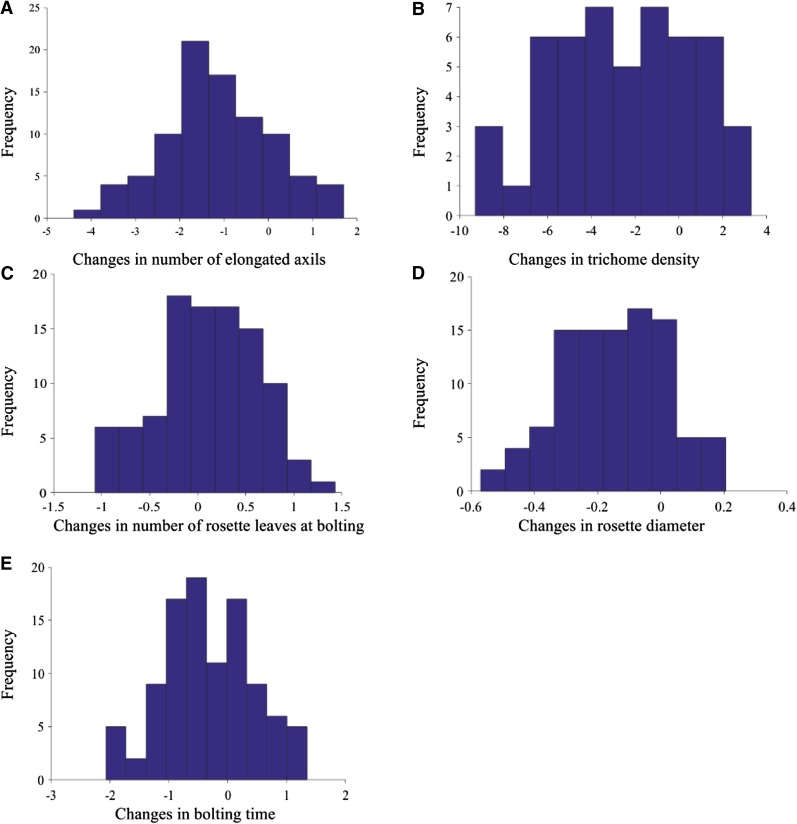
Mutations are crucial to evolution, providing the ultimate source of variation on which natural selection acts. Due to their key role, the distribution of mutational effects on quantitative traits is a key component to any inference regarding historical selection on phenotypic traits. In this paper, we expand on a previously developed test for selection that could be conducted assuming a Gaussian mutation effect distribution by developing approaches to also incorporate any of a family of heavy-tailed Laplace distributions of mutational effects. We apply the test to detect directional natural selection on five traits along the divergence of Columbia and Landsberg lineages of Arabidopsis thaliana, constituting the first test for natural selection in any organism using quantitative trait locus and mutation accumulation data to quantify the intensity of directional selection on a phenotypic trait. We demonstrate that the results of the test for selection can depend on the mutation effect distribution specified. Using the distributions exhibiting the best fit to mutation accumulation data, we infer that natural directional selection caused divergence in the rosette diameter and trichome density traits of the Columbia and Landsberg lineages.

Keywords: mutation accumulation; neutrality; phenotype; statistical tests.


Figures

Figure 1
Figure 1
A depiction of our approach of inferring the probability distributions of mutational effects from a set of mutation accumulation data resulting from unbiased mutations, and another set resulting from downward-biased mutations. (A) A constructed example of changes in phenotype resulting from unbiased mutation in seven mutation accumulation lines. (B) A constructed example of changes in phenotype resulting from mutations with downward bias in seven mutation accumulation lines. (C, D) The Gaussian distribution characterizing mutational effects inferred from data depicted in (A). (E, F) The LSDZ distribution characterizing mutational effects inferred from data depicted in (A). (G, H) The LAPZ distribution characterizing mutational effects inferred from data depicted in (A). (I, J) The LAPZ distribution characterizing mutational effects inferred from (B). (K, M, O, Q) A depiction of a probability of fixation of mutations that does not change with increasing phenotypic values. (L, N, P, R) A depiction of a probability of fixation of mutations that increases with increasing phenotypic values. (S) The product of the distribution depicted in (C), and the function depicted in (K): in this case, a symmetrical distribution of fixed mutations with a positive mode. (T) The product of (D) and (L): in this case, an asymmetrical distribution of fixed mutations with a positive mode. (U) The product of (E) and (M): in this case, a symmetrical distribution of fixed mutations with a near zero mode. (V) The product of (F) and (N): in this case, an asymmetrical distribution of fixed mutations with a positive mode. (W) The product of (G) and (O): in this case, a symmetrical distribution of fixed mutations with a negative mode. (X) The product of (H) and (P): in this case, an asymmetrical distribution of fixed mutations with a positive mode. (Y) The product of (I) and (Q): in this case, an asymmetrical distribution of fixed mutations with a zero mode. (Z) The product of (J) and (R): in this case, an asymmetrical distribution of fixed mutations with a positive mode.
Figure 2
Figure 2
A depiction of our approach of inferring the likelihood values of a range of strength of selection values from a distribution in Figure 1 and quantitative trait locus data for a phenotype. (A–D) Examples of a single sample of mutations, which are shown by the outlines, drawn from the distribution in (S), (T), (W), and (X) of Figure 1, respectively, and the experimentally observed positive and negative QTL, shown by the colored bars. (E) A plot of the likelihood values across a range of strength of selection values. Samples drawn from the distribution in (S) seem to fit better than samples drawn from distribution (T). The region of the plot above the dashed red line correspond to the 95% confidence interval. The point at the y-axis (black) corresponds to neutral evolution and lies inside the 95% confidence interval, while the point (red) in the first quadrant corresponds to evolution driven by natural selection, and lies outside the 95% confidence interval. Therefore, we cannot reject the neutral hypothesis. (F) A plot of the likelihood values across a range of strength of selection values. Samples drawn from the distribution in (X) seem to fit better than samples drawn from distribution (W). The region of the plot above the dashed red line correspond to the 95% confidence interval. The point at the y-axis (red) corresponds to neutral evolution and lies outside the 95% confidence interval, while the point in the first quadrant (black) corresponds to evolution driven by natural selection and lies inside the 95% confidence interval. Therefore, we can reject the neutral hypothesis in favor of the hypothesis of evolution driven by natural selection and estimate that the strength of selection corresponds to the strength of selection indicated by this point.
Figure 3
Figure 3
The effect sizes and the SEs of rosette diameter, number of elongated axils, number of rosette leaves at bolting, bolting time, and trichome density QTL. The sign of the effect size corresponds to the direction of effect of the Columbia allele on the phenotype.
Figure 4
Figure 4
Frequency distribution of changes in quantitative traits during mutation accumulation. (A) Distribution of the changes in the number of elongated axils. (B) Distribution of the changes in trichome density. (C) Distribution of the changes in number of rosette leaves at bolting. (D) Distribution of the changes in rosette diameter. (E) Distribution of the changes in bolting time.
Figure 5
Figure 5
The normalized AIC of the Gaussian and Laplace distributions for the number of rosette leaves at bolting, bolting time, rosette diameter, number of elongated axils, and trichome density of A. thaliana. The normalized AIC for the LSPZ distribution was excluded, because its measure was very high—beyond the scale of the other distributions.
Figure 6
Figure 6
Maximum likelihood estimates and the corresponding 95% confidence intervals of the selection values in units of 10−5 for bolting time, number of rosette leaves at bolting, number of elongated axils, rosette diameter, and trichome density using all nine distributions. There were no upper bounds for the 95% confidence intervals for trichome density, because the log likelihood values described a positive (but diminishing) slope as the strength of selection became larger. This phenomenon is a consequence of all of the observed QTL for trichome density exhibiting a single direction. Although not all estimates of the strength of selection statistically reject a value of zero, all traits are estimated to be under positive selection toward high values of the five quantitative traits in Columbia, consistent with the observation of higher values of these traits in Columbia, and the apparent downward pressure of mutational effects on the traits.

References

    1. Anderson E., Slatkin M., 2003. Orr’s quantitative trait loci sign test under conditions of trait ascertainment. Genetics 165: 445–446. - PMC - PubMed
    1. Atwood K. C., Schneider L. K., Ryan F. J., 1951. Periodic selection in Escherichia coli. Proc. Natl. Acad. Sci. USA 37(3): 146–155. - PMC - PubMed
    1. Behringer M. G., Hall D. W., 2016. The repeatability of genome-wide mutation rate and spectrum estimates. Curr. Genet. 62(3): 507–512. - PMC - PubMed
    1. Bloomer R. H., Juenger T. E., Symonds V. V., 2012. Natural variation in GL1 and its effects on trichome density in Arabidopsis thaliana. Mol. Ecol. 21(14): 3501–3515. - PubMed
    1. Bowman A. W., Azzalini A., 1997. Applied Smoothing Techniques for Data Analysis. Oxford University Press Inc., New York.