. 2017 Aug;66(8):2102-2111.
doi: 10.2337/db16-1558. Epub 2017 May 26.

Hypothalamic Ventromedial Lin28a Enhances Glucose Metabolism in Diet-Induced Obesity

Affiliations

Hypothalamic Ventromedial Lin28a Enhances Glucose Metabolism in Diet-Induced Obesity

Jung Dae Kim et al. Diabetes. 2017 Aug.

Abstract

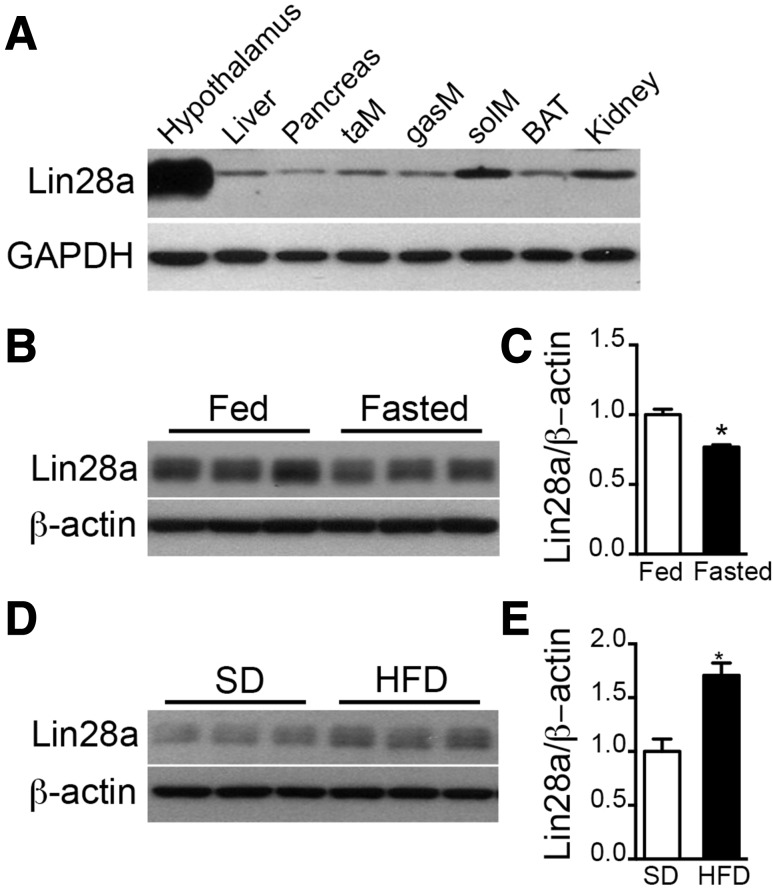
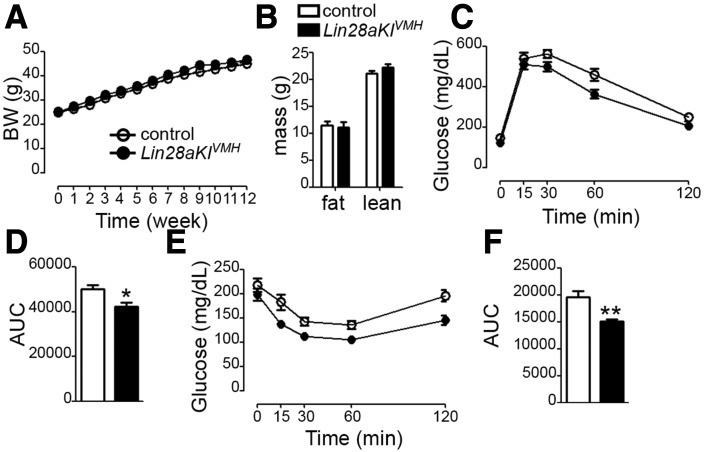
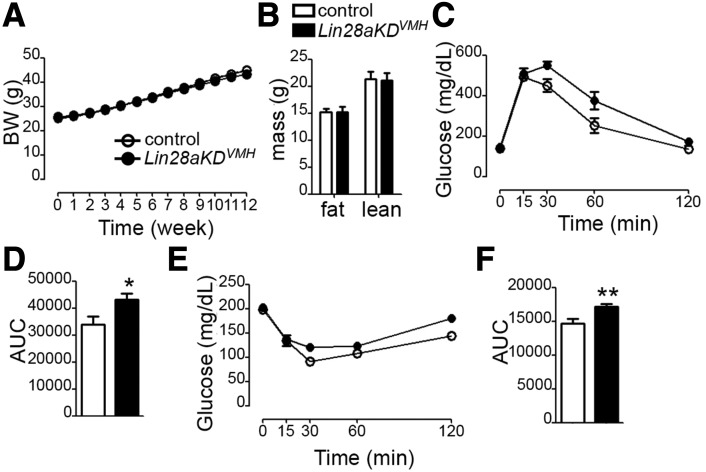
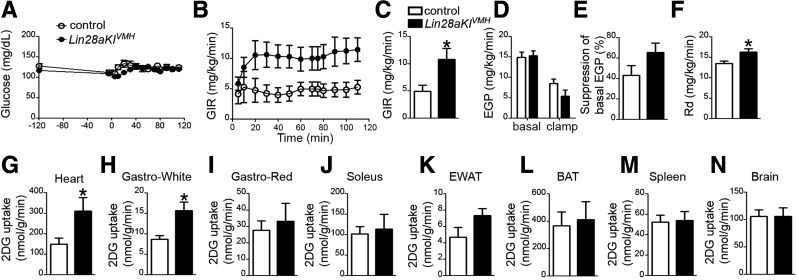
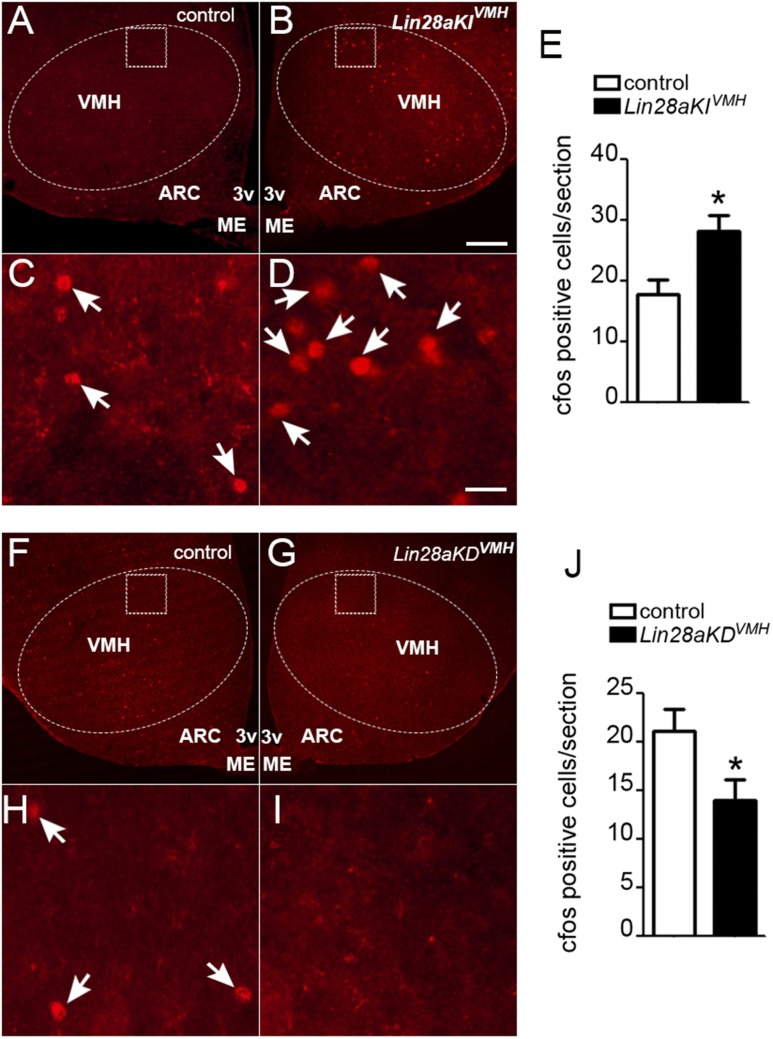
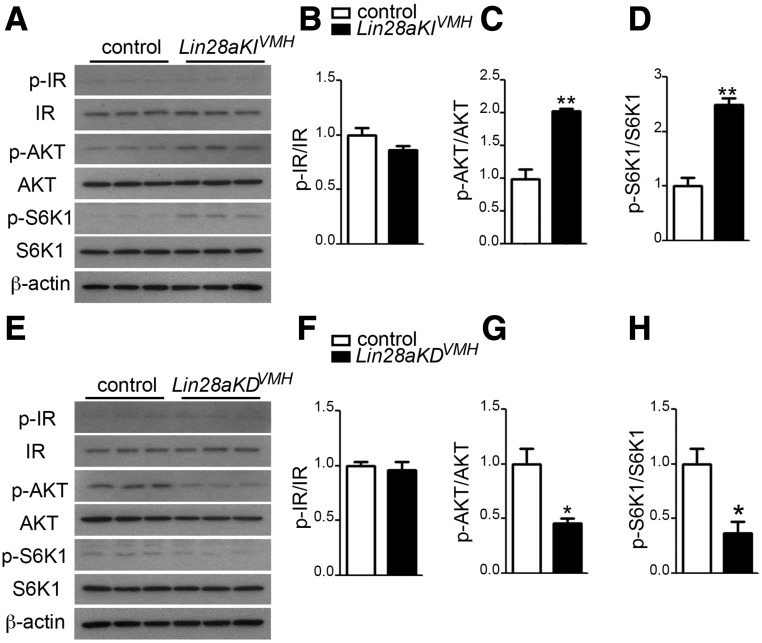
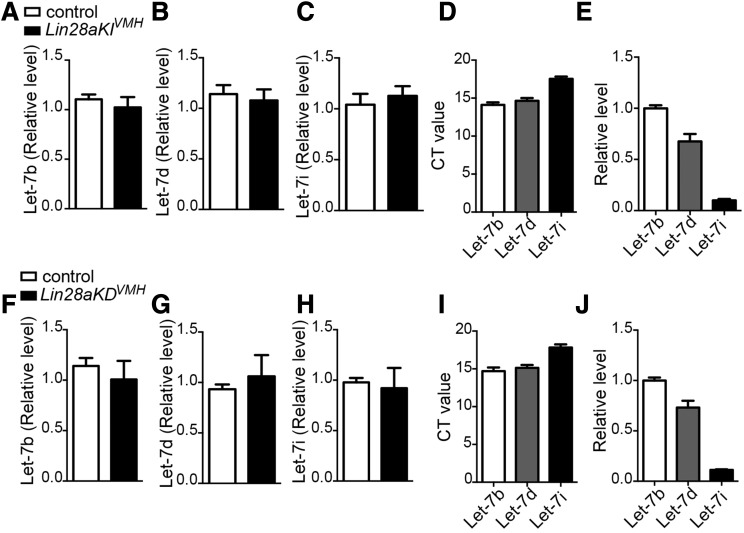
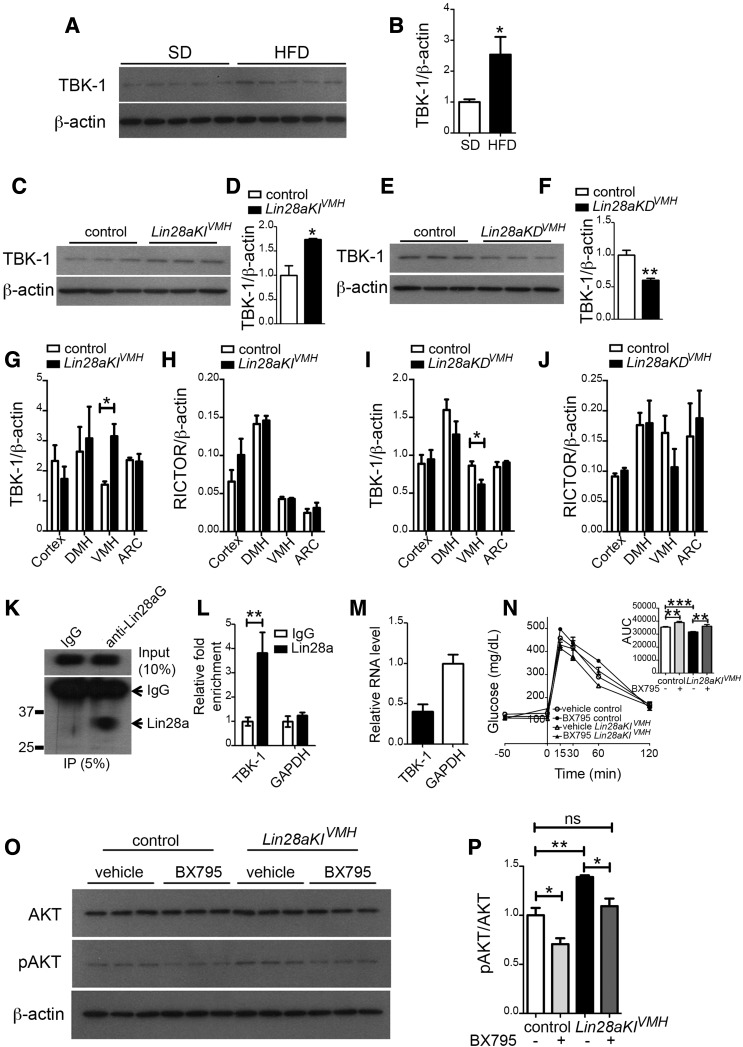
The Lin28a/Let-7 axis has been studied in peripheral tissues for its role in metabolism regulation. However, its central function remains unclear. Here we found that Lin28a is highly expressed in the hypothalamus compared with peripheral tissues. Its expression is positively correlated with positive energy balance, suggesting a potential central role for Lin28a in metabolism regulation. Thus, we targeted the hypothalamic ventromedial nucleus (VMH) to selectively overexpress (Lin28aKIVMH ) or downregulate (Lin28aKDVMH ) Lin28a expression in mice. With mice on a standard chow diet, body weight and glucose homeostasis were not affected in Lin28aKIVMH or Lin28aKDVMH mice. On a high-fat diet, although no differences in body weight and composition were observed, Lin28aKIVMH mice showed improved glucose tolerance and insulin sensitivity compared with controls. Conversely, Lin28aKDVMH mice displayed glucose intolerance and insulin resistance. Changes in VMH AKT activation of diet-induced obese Lin28aKIVMH or Lin28aKDVMH mice were not associated with alterations in Let-7 levels or insulin receptor activation. Rather, we observed altered expression of TANK-binding kinase-1 (TBK-1), which was found to be a direct Lin28a target mRNA. VMH-specific inhibition of TBK-1 in mice with diet-induced obesity impaired glucose metabolism and AKT activation. Altogether, our data show a TBK-1-dependent role for central Lin28a in glucose homeostasis.


Figures

Figure 1
Figure 1
Lin28a is highly expressed in the hypothalamus and is metabolically regulated. A: Western blot analysis showing the relative expression levels of Lin28a in tissues including the hypothalamus, liver, pancreas, tibialis anterior muscle (taM), gastrocnemius muscle (gasM), soleus muscle (solM), BAT, and kidney. B: Representative Western blot image of Lin28a expression in hypothalamic samples from fed (n = 4) and overnight fasted (n = 3) mice. C: Graph of densitometry analysis of Lin28a showing a significant decrease of Lin28a after an overnight fast. D: Representative Western blot image of Lin28a expression in hypothalamic samples from mice exposed to an SD (n = 3) and 12 weeks of HFD (45% HFD) (n = 5). E: Graph of densitometry analysis of Lin28a showing a significant increase of Lin28a after HFD feeding. Data represent the mean ± SEM. *P < 0.05.
Figure 2
Figure 2
VMH-selective Lin28a overexpression improves glucose metabolism. A and B: Graphs showing body weight (BW) and body fat and lean mass in Lin28aKIVMH mice (n = 8) and controls (n = 8) exposed to an HFD (45%). C and D: Graphs showing GTT (C) and the area under the curve (AUC) (D) in DIO Lin28aKIVMH mice (n = 8) and controls (n = 8) after 8 weeks’ exposure to an HFD (45%). E and F: Graphs showing insulin tolerance test (E) and the area under the curve (F) in DIO Lin28aKIVMH mice (n = 8) and controls (n = 8) after 8 weeks’ exposure to an HFD (45%). Data represent the mean ± SEM. *P < 0.05; **P < 0.01.
Figure 3
Figure 3
VMH-selective Lin28a downregulation impairs glucose metabolism. A and B: Graphs showing body weight (BW) and body fat and lean mass in Lin28aKDVMH mice (n = 8) and controls (n = 8) exposed to an HFD (45%). C and D: Graphs showing GTT (C) and the area under the curve (AUC) (D) in DIO Lin28aKDVMH mice (n = 8) and controls (n = 8) after 8 weeks’ exposure to an HFD (45%). E and F: Graphs showing insulin tolerance test (E) and the area under the curve (F) in DIO Lin28aKDVMH mice (n = 8) and controls (n = 8) after 8 weeks’ exposure to an HFD (45%). Data represent the mean ± SEM. *P < 0.05; **P < 0.01.
Figure 4
Figure 4
VMH-selective Lin28a overexpression improves peripheral glucose metabolism. A: Blood glucose levels during the basal and clamp periods in DIO Lin28aKIVMH mice (n = 8) and control mice (n = 8) after 8 weeks on an HFD (45%). The clamp period begins at time 0. B and C: Graphs showing glucose infusion rate (GIR) required to maintain euglycemia during the clamp period. In panel C, the data are shown as the means of the values from 70 to 115 min. D: EGP during both basal and clamp periods. E: Graph showing the percentage suppression of basal EGP induced by insulin infusion. F: Graph showing the Rd during the clamp period, which represents whole-body glucose utilization. Basal Rd is equal to basal EGP. GN: 2-[14C]-deoxy-d-glucose (2DG) uptake in the heart (G), white (Gastro-White) (H) and red (Gastro-Red) (I) portions of the gastrocnemius, soleus (J), epididymal white adipose tissue (EWAT) (K), BAT (L), spleen (M), and brain (N) during the clamp period. All data represent mean ± SEM. *P < 0.05 (n = 7–8 male mice per group).
Figure 5
Figure 5
Lin28a affects VMH neuronal activation. A and B: Representative micrographs of hypothalamic sections from control (A) and Lin28aKIVMH (B) mice showing c-Fos staining. C and D: High-power magnifications of the VMH areas highlighted in A (for C) and B (for D). E: Graph showing the results of c-Fos counting in the VMH of control and Lin28aKIVMH mice (n = 5 DIO mice per group; 8 weeks on HFD). F and G: Representative micrographs of hypothalamic sections from control (F) and Lin28aKDVMH (G) mice showing c-Fos immunostaining. H and I: High-power magnifications of the VMH areas highlighted in F (for H) and G (for I). J: Graph showing the results of c-Fos counting in the VMH of control and Lin28aKDVMH mice (n = 5 DIO mice per group; 8 weeks on HFD). *P < 0.05. Arrows indicate c-Fos labeling in nuclei. ME, median eminence; 3v, third ventricle. Bar scale in B (for A, F, and G) represents 200 μm. Bar scale in D (for C, H, and I) represents 30 μm.
Figure 6
Figure 6
Lin28a affects AKT-mTOR pathways. A: Western blot images showing p-IR, total IR, p-AKT, total AKT, p-S6K1, total S6K1, and β-actin in VMH samples of control and Lin28aKIVMH mice on an HFD (45%). BD: Graphs showing the densitometry analyses of p-IR/IR (B), p-AKT/AKT (C), and p-S6K1/S6K1 (D) in the VMH of Lin28aKIVMH mice and controls. E: Western blot images showing p-IR, total IR, p-AKT, total AKT, p-S6K1, total S6K1, and β-actin in VMH samples of control and Lin28aKDVMH mice on an HFD (45%). FH: Graphs showing the densitometry analyses of p-IR/IR (F), p-AKT/AKT (G), and p-S6K1/S6K1 (H) in the VMH of Lin28aKDVMH mice and controls. n = 3 for all groups. Data represent the mean ± SEM. *P < 0.05; **P < 0.01.
Figure 7
Figure 7
VMH Lin28a does not affect Let-7 levels. AC: Real-time PCR for Let-7b (A), Let-7d (B), and Let-7i (C) in VMH samples of Lin28aKIVMH mice and controls (n = 7 per group). D: Graph showing the cycle threshold (CT) values of Let-7b, Let-7d, and Let-7i in the VMH of Lin28aKIVMH mice and controls (n = 7 per group). E: Graph showing the relative RNA levels of Let-7b, Let-7d, and Let-7i in the VMH of Lin28aKIVMH mice and controls (n = 7 per group). FH: Real-time PCR for Let-7b (F), Let-7d (G), and Let-7i (H) in VMH samples of Lin28aKDVMH mice and controls (n = 5 per group). I: Graph showing the CT values of Let-7b, Let-7d, and Let-7i in the VMH of Lin28aKDVMH mice and controls (n = 5 per group). J: Graph showing the relative RNA levels of Let-7b, Let-7d, and Let-7i in the VMH of Lin28aKDVMH mice and controls (n = 5 per group). Data represent the mean ± SEM.
Figure 8
Figure 8
VMH Lin28a targets TBK-1 mRNA. A and B: Western blot images (A) and densitometry analysis (B) of TBK-1 expression levels in the hypothalamus of mice exposed to either SD (n = 5) or 8 weeks of HFD (n = 5). C and D: Western blot images (C) and densitometry analysis (D) of TBK-1 expression levels in the VMH of Lin28aKIVMH mice and controls on an HFD for 8 weeks (n = 3 per group). E and F: Western blot images (E) and densitometry analysis (F) of TBK-1 expression levels in the VMH of Lin28aKDVMH mice and controls on an HFD for 8 weeks (n = 3 per group). G: Graph showing real-time PCR for TBK-1 in the cortex, DMH, VMH, and hypothalamic ARC of Lin28aKIVMH mice and controls on an HFD (for 8 weeks). H: Graph showing real-time PCR for RICTOR in the cortex, DMH, VMH, and hypothalamic ARC of Lin28aKIVMH mice and controls on an HFD (for 8 weeks). I: Graph showing real-time PCR for TBK-1 in the cortex, DMH, VMH, and hypothalamic ARC of Lin28aKDVMH mice and controls on an HFD (for 8 weeks). J: Graph showing real-time PCR for RICTOR in the cortex, DMH, VMH, and hypothalamic ARC of Lin28aKDVMH mice and controls on an HFD (for 8 weeks). K: Immunoprecipitation using polyclonal anti-Lin28a, followed by Western blot analysis. Ten percent input was loaded in the upper panel. Five percent immunoprecipitated (IP) hypothalamic samples were loaded in the lower panel. L: RIP with rabbit polyclonal anti-Lin28a or preimmune IgGs from hypothalamic extracts. RNA levels in immunoprecipitates were determined using reverse transcription and quantitative PCR. Levels of TBK-1 and GAPDH mRNA are presented as fold enrichment in anti-Lin28a relative to IgG immunoprecipitates. M: Relative RNA levels of TBK-1 and GAPDH in hypothalamic samples (n = 4 mice). N: Graph showing the results of a GTT 50 min after the VMH of HFD-fed control and Lin28aKIVMH mice (n = 6 per group) was injected with either vehicle (0.1% DMSO in saline) or BX795 (10 ng/site). AUC, area under the curve. O and P: Western blot images (O) and densitometry analysis (P) of AKT (total) and pAKT expression levels in the VMH of Lin28aKIVMH mice and controls on an HFD for 8 weeks (n = 3 per group) injected either with BX795 (10 ng/site) or with vehicle control. Data represent the mean ± SEM. *P < 0.05; **P < 0.01; ***P < 0.001. ns, not significant.

Similar articles

Cited by

References

    1. Viswanathan SR, Daley GQ, Gregory RI. Selective blockade of microRNA processing by Lin28. Science 2008;320:97–100 - PMC - PubMed
    1. Thornton JE, Gregory RI. How does Lin28 let-7 control development and disease? Trends Cell Biol 2012;22:474–482 - PMC - PubMed
    1. Frost RJ, Olson EN. Control of glucose homeostasis and insulin sensitivity by the Let-7 family of microRNAs. Proc Natl Acad Sci U S A 2011;108:21075–21080 - PMC - PubMed
    1. Zhu H, Shah S, Shyh-Chang N, et al. . Lin28a transgenic mice manifest size and puberty phenotypes identified in human genetic association studies. Nat Genet 2010;42:626–630 - PMC - PubMed
    1. Zhu H, Shyh-Chang N, Segre AV, et al. . The Lin28/let-7 axis regulates glucose metabolism. Cell 2011;147:81–94 - PMC - PubMed

MeSH terms