

ER-plasma membrane contact sites contribute to autophagosome biogenesis by regulation of local PI3P synthesis
- PMID: 28550152
- PMCID: PMC5509996
- DOI: 10.15252/embj.201797006
ER-plasma membrane contact sites contribute to autophagosome biogenesis by regulation of local PI3P synthesis
Abstract
The double-membrane-bound autophagosome is formed by the closure of a structure called the phagophore, origin of which is still unclear. The endoplasmic reticulum (ER) is clearly implicated in autophagosome biogenesis due to the presence of the omegasome subdomain positive for DFCP1, a phosphatidyl-inositol-3-phosphate (PI3P) binding protein. Contribution of other membrane sources, like the plasma membrane (PM), is still difficult to integrate in a global picture. Here we show that ER-plasma membrane contact sites are mobilized for autophagosome biogenesis, by direct implication of the tethering extended synaptotagmins (E-Syts) proteins. Imaging data revealed that early autophagic markers are recruited to E-Syt-containing domains during autophagy and that inhibition of E-Syts expression leads to a reduction in autophagosome biogenesis. Furthermore, we demonstrate that E-Syts are essential for autophagy-associated PI3P synthesis at the cortical ER membrane via the recruitment of VMP1, the stabilizing ER partner of the PI3KC3 complex. These results highlight the contribution of ER-plasma membrane tethers to autophagosome biogenesis regulation and support the importance of membrane contact sites in autophagy.
Keywords: PI3P; autophagosome; contact sites; extended synaptotagmins; organelle biogenesis.
© 2017 The Authors.
Figures
- A
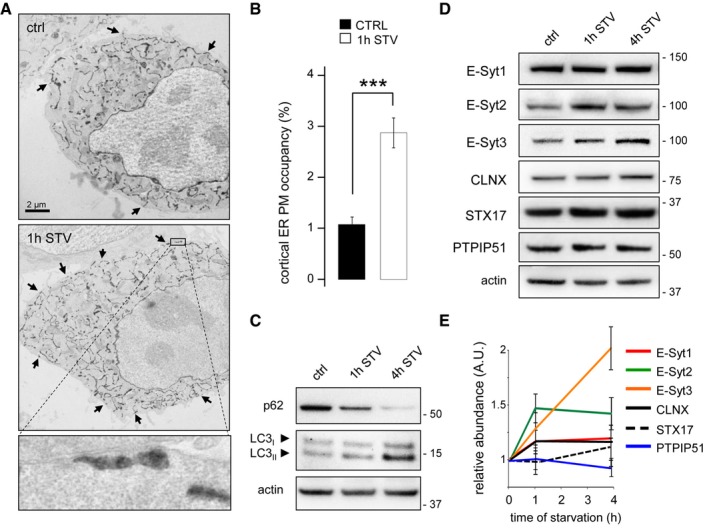
Electron micrographs of HeLa cells grown under complete medium conditions (control, ctrl) or starved for 1 h (1 h STV). HeLa cells were transfected with the ER luminal marker ssHRP‐myc‐KDEL (which enables ER identification via an electron‐dense (dark) HRP reaction) to allow detection of ER‐PM contact sites (black arrows). Scale bar, 2 μm. Representative images from one of three independent experiments are shown.
- B
Quantification of ER‐PM contact sites visualized in electron micrographs with 20 cells analysed per condition in each of three experiments. Means ± s.e.m. are plotted. ***P < 0.001, unpaired two‐tailed t‐test.
- C–E
HeLa cells were grown under control and starvation conditions for 1 and 4 h. Representative Western blots of lysates for (C) p62 and lipidated LC3 and (D) E‐Syts, calnexin (CLNX), STX17, and PTPIP51 are shown. Actin was used as a loading control. (E) Quantification of Western blots from three independent experiments. Means ± s.e.m. are plotted.

Mechanical stress: Western blots and protein quantifications of protein lysates from KEC cells under basal (ctrl) and mechanical stress (flow) conditions for 4–72 h (n = 3). Plotted are mean ± s.d.
mTOR inhibition and serum starvation: Western blots and protein quantifications (compared to ctrl) of protein lysates from HeLa cells grown under basal (ctrl) and autophagy‐inducing conditions. Cells were cultured with 1.5 μM Torin1, an mTOR inhibitor, for 2 h or in a medium without serum for 1 h, respectively (n = 3). Plotted are mean ± s.d.

HeLa cells were transfected with RFP‐Sec61β (an ER marker) and immunostained for the autophagosome marker LC3. The two markers co‐distribute in the vicinity of the plasma membrane (empty arrowheads) after 15 min of starvation (STV 15 min) as shown by confocal microscopy.
TIRF analysis after 0 (control), 15 (STV 15 min) and 60 (STV 60 min) min of starvation.
Quantification of LC3 puncta per TIRF section (n = 3; 20 cells analysed per condition). **P < 0.01, ***P < 0.001, unpaired two‐tailed t‐test. Means ± s.e.m. are plotted.
Representative confocal microscopy images and 3D reconstructions of MDCK cells immunostained for LC3, Na/K‐ATPase and DAPI under mechanical stress conditions. Arrowheads indicate LC3 puncta at vicinity of plasma membrane.

- A, B
Confocal microscope images and 3D reconstructions of HeLa cells co‐transfected with GFP‐E‐Syt2 and RFP‐Sec61β and immunostained for LC3 or ATG16L1 and DAPI. Arrowheads denote LC3 or ATG16L1 puncta near the E‐Syt2‐positive niche of the ER. Scale bars, 5 and 2.5 μm (magnified areas).
- C
Quantification of LC3 and ATG16L1 co‐distribution with E‐Syt2 at basal plan of the cell n = 80 cells. Mean ± s.e.m. shown.
- D
Immunogold electron micrographs of starved HeLa cells, showing co‐distribution of the myc‐E‐Syt2 and anti‐LC3 antibody at ER (empty arrowheads) and PM (black arrowheads) juxtaposition sites. Scale bar, 250 nm.

STED images of the basal plane of a HeLa cell co‐transfected with vectors for expression of the ER marker Sec61βGFP and the ER‐PM contact marker mCherry‐E‐Syt3 and immunostained for the autophagosome marker LC3. Scale bars, 5 μm. Arrowheads indicate autophagic structures (LC3) arising from ER niches (Sec61β‐positive) at ER‐PM contact sites (E‐Syt3‐positive).
Three‐dimensional reconstruction from confocal microscope images of HeLa cells co‐transfected with vectors for expression of Sec61βRFP and E‐Syt2GFP and immunostained for LC3. Scale bar, 2.5 μm. The arrowheads indicate the LC3‐positive structures.
Electron micrographs of HeLa cells starved 1 h and transfected with a vector for expression of the ER luminal marker ssHRP‐myc‐KDEL, showing early autophagic structures in the proximity of the PM. Scale bar, 400 nm.
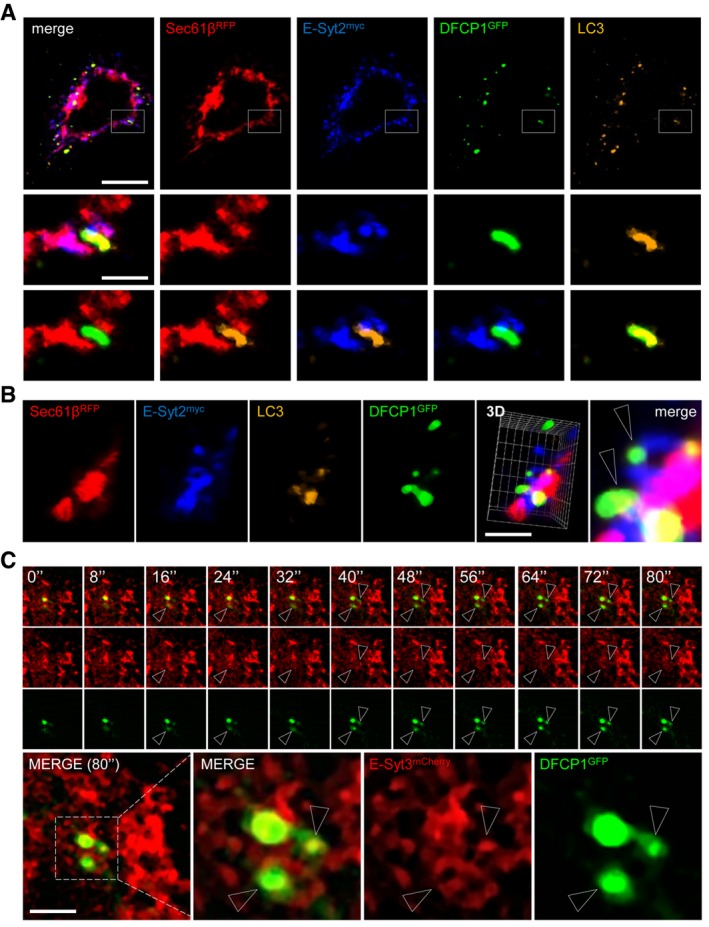
Representative confocal microscopy images taken in the basal plane of a HeLa cell expressing myc‐E‐Syt2, RFP‐Sec61β and GFP‐DFCP1 and immunostained for LC3. Scale bars, 10 and 3 μm (magnified areas).
3D reconstructions of representative HeLa cell expressing myc‐E‐Syt2, RFP‐Sec61β and GFP‐DFCP1 and immunostained for LC3. Arrowheads denote DFCP1 and LC3 puncta connected with E‐Syt2‐positive niches of the ER. Scale bar, 5 μm.
Time‐lapse confocal images of HeLa cells expressing mCherry‐E‐Syt3 and GFP‐DFCP1 after cells were starved for 15 min. Two channels were observed simultaneously using two cameras. Arrowheads denote DFCP1 puncta in E‐Syt2‐positive niches of the ER. Scale bar, 5 μm.

- A, B
Confocal microscope images of HeLa cells co‐transfected with GFP‐DFCP1 (an omegasome marker), RFP‐Sec61β (an ER marker) and myc‐E‐Syt2 (an ER‐PM contact sites marker) or immunostained for TOM20 (a mitochondria marker) under starved conditions (15 min). Arrowheads denote omegasome formation at (A) ER‐PM or (B) ER–mitochondria contact sites. Scale bars, 10 μm.
- C
Quantification of percent DFCP1‐positive structures at ER‐PM (Sec61β/E‐Syt2 interface) and ER–mitochondria (Sec61β/TOM20 interface) contact sites. Plotted are mean ± s.e.m., n = 80.
- D
Electron microscopy images of HeLa cells transfected with the ER luminal marker ssHRP‐myc‐KDEL and starved for 1 h showing autophagic structures adjacent (within 1 μm) to ER‐PM contact sites (ER‐PM), ER‐mitochondria contact sites (ER‐mito) and to neither organelle (cytoplasm). The quantification of these autophagic structures is shown as well. Plotted are means ± s.e.m., n = 80 cells.
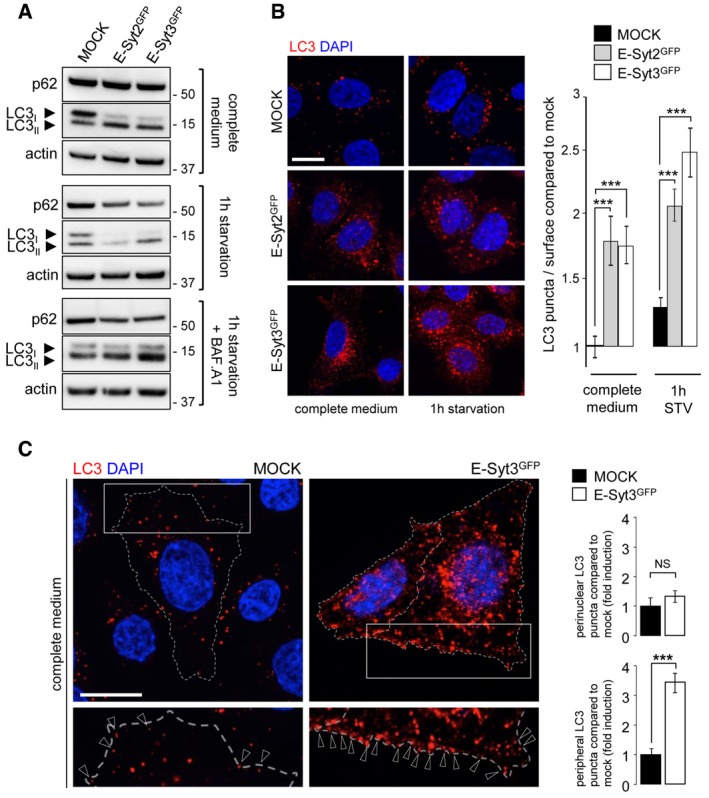
Western blot analysis of the autophagic flux in cell lysates from control (mock) and GFP‐E‐Syt2 or GFP‐E‐Syt3‐expressing HeLa cells, under complete medium and starvation (1 h EBSS) conditions, without or with Bafilomycin A1 (+BAF. A1).
HeLa cells expressing GFP‐E‐Syt2 or GFP‐E‐Syt3 were immunostained for LC3. Compared to control (mock), transfected cells showed a dramatic increase in LC3 puncta, in both basal (complete medium) and starved (1 h) conditions, as evidenced by counting of LC3 puncta (n = 3; 20 cells per condition).
The increase in LC3 puncta observed in cells overexpressing E‐Syt3GFP (similar results were obtained with E‐Syt2GFP, data not shown) involves mainly peripheral rather than perinuclear cellular regions (n = 3). Arrowheads indicate peripheral LC3 puncta (n = 3; 20–70 cells per condition).
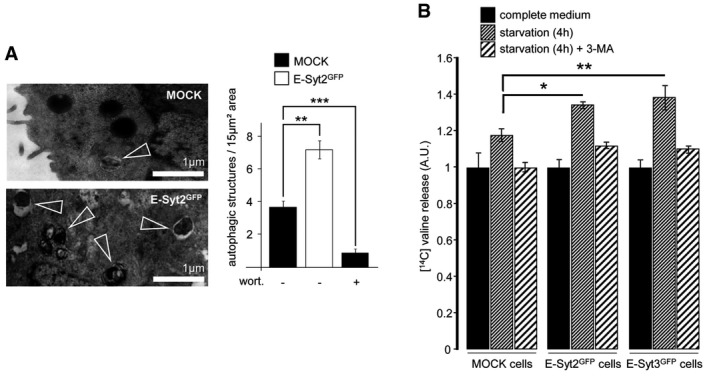
An electron micrograph of GFP‐E‐Syt2‐expressing HeLa cells starved for 1 h, showing an increased number of autophagic structures (arrowheads) compared to starved control cells. Scale bar, 1 μm. Wortmannin (wort, 100 nM) was used as a negative control, and autophagic structures were counted in 15 μm2 areas (n = 10 cells).
Proteolysis analysis showing an increased protein degradation rate in GFP‐E‐Syt2‐ and GFP‐E‐Syt3‐expressing cells (n = 3). 3‐methyladenine (3‐MA) was used at 10 mM.

- A, B
HeLa cells were treated with control siRNA (siCTRL) or with siRNAs targeting mRNAs encoding each of the E‐Syts (siE‐Syts). (A) Western blots of cell lysates. Actin is used as a loading control. (B) E‐Syts mRNAs were quantified. Means ± s.d. are plotted (n = 3).
- C
HeLa cells stably transfected with GFP‐LC3 and treated with siE‐Syts or siCTRL were not treated (−BAF. A1) or were treated with Bafilomycin A1 (+BAF. A1). Representative images are shown. Empty arrowheads indicate peripheral LC3 puncta. Scale bars, 10 μm.
- D
Quantification of experiments shown in panel (C) (n = 3; 20 cells per condition). Means ± s.e.m. are plotted.
- E
HeLa cells treated with control siCTRL or with siE‐Syts were grown in complete medium or were starved for 1 or 4 h, and cells lysates were subjected to Western blot for indicated proteins.
- F
Quantification of Western blot shown in panel (E), with 20 cells analysed per condition (n = 5).
- A, B
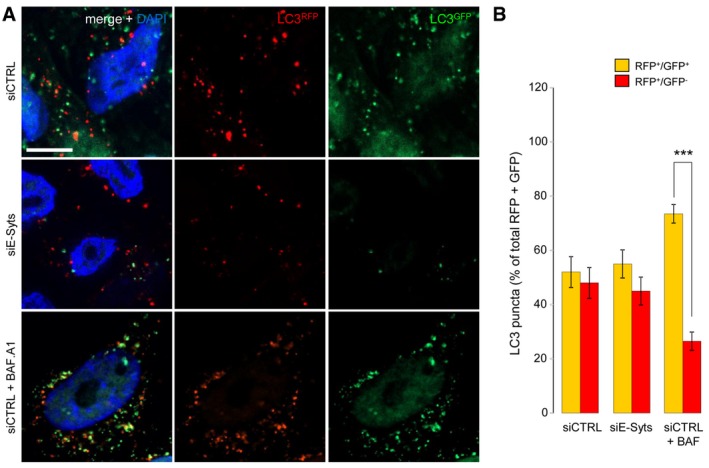
HeLa cells stably transfected with mRFP‐GFP‐LC3 and treated with siE‐Syts have fewer autophagosomes, but autophagosomes have normal functionality, as evidenced by (A) microscopy and (B) by RFP+/GFP+ and RFP+/GFP− LC3‐puncta counting. Cells treated with Bafilomycin A1 (+BAF. A1) and siCTRL were used as a positive functionality control and showed decreased autophagosome maturation (i.e. reduced RFP+/GFP− LC3‐puncta compared to siCTRL‐treated cells) as expected (n = 3). ***P < 0.001, unpaired two‐tailed t‐test. Scale bar, 10 μm. Plotted are mean ± s.e.m.

- A
Representative confocal images of HeLa cells transfected with non‐targeting siRNA (siCTRL) or with siRNAs targeted to the three E‐Syts (siE‐Syts) grown under basal and starvation conditions with or without wortmannin (WORT, a PI3K inhibitor) and immunostained for PI3P (detected by the GST‐2xFYVE peptide), EEA1 (an endosomal marker) and DAPI (to stain nuclei). Scale bars, 10 μm.
- B, C
Quantifications of confocal images for (B) PI3P‐positive and (C) PI3P‐ and EEA1‐positive structures per area (250 μm2). Plotted are means ± s.e.m. of 15–30 images from three independent experiments; ***P < 0.001, unpaired two‐tailed t‐test.
- D
Western blots of protein lysates and immunoprecipitates from siCTRL‐ or siE‐Syt‐transfected HeLa cells immunostained for VPS34. Actin was used as a loading control.
- E
Quantification of in vitro VPS34 enzymatic activity in siCTRL‐ and siE‐Syt‐transfected HeLa cells. NS, non‐significant, unpaired two‐tailed t‐test (n = 3). Means ± s.e.m. are plotted.
- F
HeLa cells transfected with GFP‐E‐Syt2 and RFP‐Sec61β (an ER marker) were immunostained for WIPI2 (a PI3P‐binding protein) and DAPI. Empty arrowheads indicate co‐distribution of Sec61β/WIPI2/E‐Syt2. Scale bars, 5 μm.
- G, H
Representative confocal images of (left) HeLa cells transfected with the ER‐PM markers GFP‐E‐Syt2 and mCherry‐E‐Syt3 (wt) and siCTRL; (middle) HeLa cells transfected with siE‐Syts and GFP‐E‐Syt2 and mCherry‐E‐Syt3 vectors (rescue experiment); (right) HeLa cells transfected with siE‐Syts and vectors for expression of the tethering‐defective mutants GFP‐∆C2C‐E‐Syt2 and mCherry‐∆C2C‐E‐Syt3. Cells were immunostained for WIPI2 and with DAPI, and (G) perinuclear and (H) peripheral planes are shown. Scale bars, 10 μm. WIPI2 staining is shown as glow picture (signal intensity).
- I
Quantifications of perinuclear and peripheral WIPI2 puncta from experiments described in panels (G and H). Plotted are means ± s.e.m. of 15–30 images. ***P < 0.001, NS, non‐significant, unpaired two‐tailed t‐test.
- J
Western blots from protein lysates of the cells from experiments described in panels (G, H) immunostained as indicated. Actin was used as a loading control.
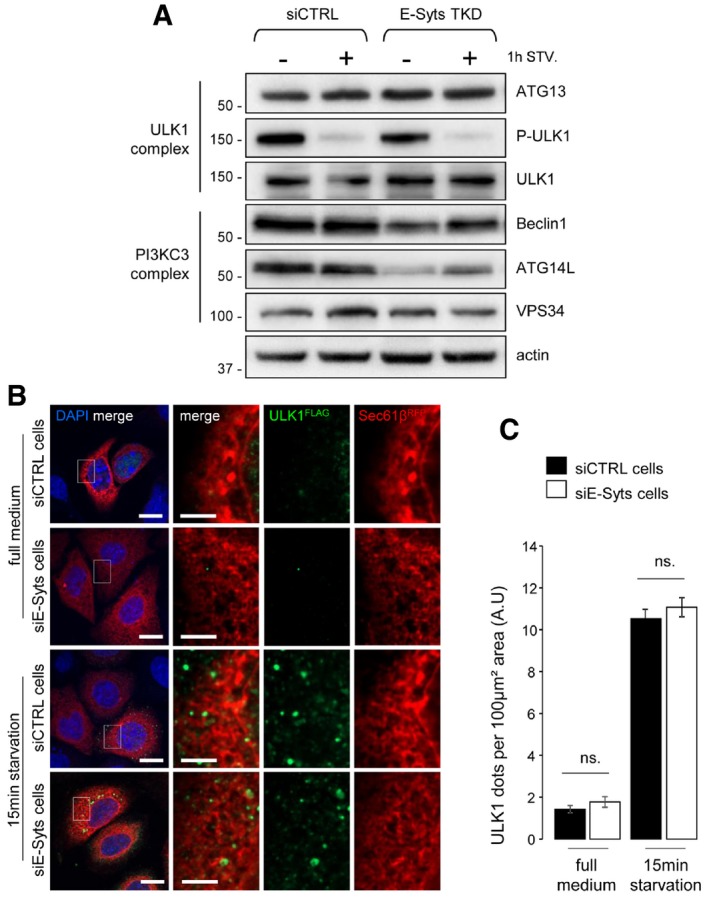
Western blots of protein lysates from siCTRL‐ and siE‐Syt‐treated HeLa cells grown in complete (−) and 1 h of starvation (+1 h STV.) conditions (n = 3). Actin is used as a loading control.
Confocal microscope images of HeLa cells co‐transfected with FLAG‐ULK1 and RFP‐Sec61β. Nuclei are marked with DAPI. Scale bars, 10 and 4 μm (magnified areas).
Quantification of ULK1 puncta in images from (B) (n = 3; 20 cells analysed). Mean ± s.e.m. are plotted. NS, non‐significant, unpaired two‐tailed t‐test.

Confocal images of HeLa cells co‐transfected with the ER marker RFP‐Sec61β and GFP‐VMP1 and immunostained for the autophagosome marker LC3, showing the localization of VMP1, after 15 min of starvation. ER‐associated and non‐associated LC3‐positive autophagic structures are indicated by white and yellow arrowheads, respectively; autophagosomes are indicated by light blue arrowheads.
Confocal images of HeLa cells co‐transfected with the ER‐PM contact marker mCherry‐E‐Syt3 and GFP‐VMP1, starved for 15 min and immunostained for LC3, showing the localization of VMP1 at ER‐PM contact sites associated or not with LC3‐positive autophagic structures (white and empty arrowheads, respectively).
Confocal images of HeLa cells co‐transfected with RFP‐Sec61β, myc‐E‐Syt2 and GFP‐VMP1, starved for 15 min and immunostained for LC3. DAPI is used to mark nuclei. Arrowheads indicate local codistribution of GFP‐VMP1, myc‐E‐Syt2 and RFP‐Sec61β.

Representative confocal images of HeLa cells expressing GFP‐VMP1, FLAG‐Beclin1 and mCherry‐E‐Syt3 and immunostained for DAPI. Empty arrowheads indicate sites of co‐distribution of VMP1, Beclin1 and E‐Syt3. Scale bar, 10 μm.
Time‐lapse images of HeLa cells expressing mCherry‐E‐Syt3, GFP‐VMP1 and CFP‐Beclin1 under starved conditions (5 min). Three channels were observed simultaneously using three cameras. Empty arrowheads indicate VMP1 present at ER‐PM contact sites positive for the early autophagy marker Beclin1. Scale bar, 5 μm.
Western blots of protein lysates from HeLa cells transfected with vectors for expression of GFP‐E‐Syt2 or mCherry‐E‐Syt3 or both or with empty vector. The analysed antibodies are listed on the left. Actin was used as a loading control.
Western blots of protein lysates and immunoprecipitates of HeLa cells transiently co‐transfected with vectors for expression of myc‐Beclin1 and GFP‐E‐Syt2 or empty vector; cells were grown in complete medium or starved for 30 min. Samples were immunoprecipitated using GFP‐trap beads and immunostained with indicated antibodies.
Comment in
-
Autophagy: Membrane contacts lend a hand.Nat Rev Mol Cell Biol. 2017 Jul;18(7):404-405. doi: 10.1038/nrm.2017.55. Epub 2017 May 31. Nat Rev Mol Cell Biol. 2017. PMID: 28559575 No abstract available.
References
-
- Calvo‐Garrido J, King JS, Muñoz‐Braceras S, Escalante R (2014) Vmp1 regulates PtdIns3P signaling during autophagosome formation in Dictyostelium discoideum . Traffic 15: 1235–1246 - PubMed
-
- Carlos Martín Zoppino F, Damián Militello R, Slavin I, Álvarez C, Colombo MI (2010) Autophagosome formation depends on the small GTPase Rab1 and functional ER exit sites. Traffic 11: 1246–1261 - PubMed
Publication types
MeSH terms
Substances
LinkOut - more resources
Full Text Sources
Other Literature Sources
