. 2018 May;55(5):3916-3930.
doi: 10.1007/s12035-017-0624-1. Epub 2017 May 26.

Prion-Like Seeding of Misfolded α-Synuclein in the Brains of Dementia with Lewy Body Patients in RT-QUIC

Affiliations

Prion-Like Seeding of Misfolded α-Synuclein in the Brains of Dementia with Lewy Body Patients in RT-QUIC

Kazunori Sano et al. Mol Neurobiol. 2018 May.

Abstract

The prion-like seeding of misfolded α-synuclein (αSyn) involved in the pathogenesis of Lewy body diseases (LBD) remains poorly understood at the molecular level. Using the real-time quaking-induced conversion (RT-QUIC) seeding assay, we investigated whether brain tissues from cases of dementia with Lewy bodies (DLB), which contain serine 129 (Ser129)-phosphorylated insoluble aggregates of αSyn, can convert Escherichia coli-derived recombinant αSyn (r-αSyn) to fibrils. Diffuse neocortical DLB yielded 50% seeding dose (SD50) values of 107~1010/g brain. Limbic DLB was estimated to have an SD50 value of ~105/g brain. Furthermore, RT-QUIC assay discriminated DLB from other neurological and neurodegenerative disorders. Unexpectedly, the prion-like seeding was reconstructed in reactions seeded with oligomer-like species, but not with insoluble aggregates of r-αSyn, regardless of Ser129 phosphorylation status. Our findings suggest that RT-QUIC using r-αSyn can be applied to detect seeding activity in LBD, and the culprit that causes prion-like seeding may be oligomeric forms of αSyn.

Keywords: Dementia with Lewy bodies (DLB); Prion; Real-time quaking-induced conversion (RT-QUIC); α-synuclein.


Conflict of interest statement

Conflict of Interest

The authors declare that they have no conflict of interest.

Figures

Fig. 1
Fig. 1
Purification and structural analysis of recombinant α-synuclein. a, b The purified His-tagged recombinant human αSyn (His-r-αSyn), His-r-αSyn after treatment with DAPase (His-r-αSyn + DAPase), and the product after removal of His-r-αSyn and DAPase (r-αSyn) were examined by Coomassie brilliant blue (CBB)-stained SDS-PAGE and western blotting analysis with polyclonal anti-αSyn antibody D119 and anti-His antibody. a CBB-stained SDS-PAGE analysis showed that the size of His-r-αSyn was shifted from 18 to 17 kDa after treatment with DAPase, and a single major band of the protein was observed after removal of His-r-αSyn and DAPase. b A similar shift in molecular size of His-r-αSyn was also observed by immunoblotting using polyclonal anti-αSyn antibody D119. The purified r-αSyn was confirmed not to be detected by immunoblotting using anti-His-tag antibody. Molecular mass markers are indicated in kilodaltons (kDa) on the left side of each panel. c, d r-αSyn was loaded onto 4% – 16% Bis-Tris native PAGE gels (Invitrogen) and separated by BN-PAGE. c CBB-stained BN-PAGE and d western blotting analysis with polyclonal anti-αSyn antibody D119 revealed a native αSyn band at approximately 60 kDa, suggesting a tetramer (theoretical mass of monomer  =  14,460.1 Da). e Circular dichroism (CD) spectrum of r-αSyn showed a minimum mean residue ellipticity at 199 nm, characteristic of disordered protein. f Fourier transform infrared spectroscopy (FTIR) spectrum of r-αSyn. The FTIR spectrum showed a prominent band at 1650 cm−1 assigned to a disordered structure
Fig. 2
Fig. 2
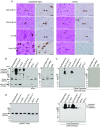
Characterization of α-synuclein from human brains by histochemical and western blotting analysis. a Hematoxylin and eosin staining and immunohistochemical staining using an antibody against phosphorylated αSyn in the substantia nigra and the cortex of the frontal lobe from two patients with DN-DLB (cases #1 and #2), a patient with Li-DLB, and non-DLB case (breast cancer patient). The arrows and arrowheads show LB and pSer129-αSyn, respectively. Scale bar, 50 mm. b, c, d The samples of BH from DN-DLB (cases #1 and #2), Li-DLB, schizophrenia, Alzheimer’s disease (AD) (cases #1 and #2), sporadic Creutzfeldt–Jakob disease (sCJD) type 1 (sCJD MM1) (case #1 and #2), sCJD type 2 (sCJD MM2), and Gerstmann–Sträussler–Scheinker syndrome (GSS) patients were immunoblotted with b polyclonal anti-αSyn antibody D119, c monoclonal anti-pSer129-αSyn antibody, and d polyclonal anti-Ser87-phosphorylated αSyn antibody. In the immunoblotting analysis for pSer129-αSyn presented in c, the samples were detected at a short exposure time of 30 s (upper panel) and long exposure time of 2 min (lower panel). Molecular mass markers are indicated in kilodaltons (kDa) on the left side of each panel. The arrows indicate the top of the stacking gel
Fig. 3
Fig. 3
Fibril formation of r-αSyn in RT-QUIC reactions. a RT-QUIC was performed using human r-αSyn with the indicated dilutions of BH from DN-DLB (cases #1 and #2), Li-DLB, schizophrenia (Sc), AD (cases #1 and #2), sCJD MM1 (cases #1 and #2), sCJD MM2, and GSS patients, or without seed (no-seeded). The colored curves represent the kinetics of ThT fluorescence average of all six replicate wells. See also Supplementary Fig. S3. b The values of maximal fluorescence intensities and lag phase obtained in individual samples after 96-h reaction are plotted in the upper and lower graphs, respectively. Lag phase was defined as the time required to reach a fluorescence intensity > 120 arbitrary units. The horizontal bars indicate means  ±  standard deviation. The data for maximal fluorescence intensities were analyzed by one-way ANOVA, followed by the Tukey–Kramer test. Analysis of the data for lag phase was performed by the log-rank and Tukey–Kramer tests. **P  <  0.01 (compared with no-seeded); *P  <  0.05 (compared with no-seeded)
Fig. 4
Fig. 4
Western blotting and RT-QUIC analysis of another four DN-DLB brains. a The samples of BH from DN-DLB patients (cases #3, #4, #5 and #6) were immunoblotted with polyclonal anti-αSyn antibody D119 and monoclonal anti-pSer129-αSyn antibody. Molecular mass markers are indicated in kilodaltons (kDa) on the left side of each panel. The arrows indicate the top of the stacking gel. b RT-QUIC was performed using human r-αSyn with the indicated dilutions of BH from DN-DLB. The colored curves represent the kinetics of ThT fluorescence average of all six replicate wells. See also Supplementary Fig. S4. c The values of maximal fluorescence intensities and lag phase obtained in individual samples after 96-h reaction are plotted in the upper and lower graphs, respectively. Lag phase was defined as the time required to reach a fluorescence intensity > 120 arbitrary units. The horizontal bars indicate means  ±  standard deviation. The data for maximal fluorescence intensities were analyzed by one-way ANOVA, followed by the Tukey–Kramer test. Analysis of the data for lag phase was performed by the log-rank and Tukey–Kramer tests. **P  <  0.01 (compared with no-seeded); *P  <  0.05 (compared with no-seeded)
Fig. 5
Fig. 5
Seeding activity of insoluble aggregates of r-αSyn induced by incubation. WT or S129A r-αSyn (14 μg) was incubated at 37 °C in the presence (+) or absence (−) of 140 U of casein kinase 2 (CK2) or 200 μM ATP in 35 μl of reaction buffer (20 mM Tris-HCl, pH 7.5, 50 mM KCl, and 10 mM MgCl2). a After 0 (left panel), 72 (central panel), or 264 h (right panel) of incubation, the samples were immunoblotted with polyclonal anti-αSyn antibody D119 and monoclonal anti-pSer129-αSyn antibody. Molecular mass markers are indicated in kilodaltons (kDa) on the left side of each panel. The arrows indicate the top of the stacking gel. b Levels of ThT fluorescence of WT r-αSyn mixed with CK2 in the absence (WTCK2) or presence (WTCK2+ATP) of ATP and S129A r-αSyn mixed with CK2 and ATP (S129ACK2+ATP) were measured after 0, 72, 168, and 264 h of incubation. Data are expressed as means  ±  standard deviation (n  =  4). c WT or S129A r-αSyn incubated with CK2 and ATP for 0 (WT-0 h and S129A-0 h) or 264 h (WT-264 h and S129A-264 h) were subjected to FTIR analysis. d Samples were examined by TEM. Bars, 200 nm. e Seeding activity of WT-0 h, WT-264 h, S129A-0 h, and S129A-264 h samples was evaluated at dilutions of 2 × 10−2 and 2 × 10−4 by RT-QUIC. The colored curves represent the kinetics of ThT fluorescence averaged over three or four replicate wells
Fig. 6
Fig. 6
Seeding activity of r-αSyn oligomers generated by RT-QUIC. a Fibril formation of WT or S129A r-αSyn (12.5 μg) was induced in the presence of only 125 U of CK2 (WTCK2 and S129ACK2) or both 125 U of CK2 and 200 μM ATP (WTCK2+ATP and S129ACK2+ATP) by RT-QUIC without seed. The colored curves represent the kinetics of ThT fluorescence averaged over triplicate wells. b RT-QUIC samples (WTCK2, WTCK2+ATP, S129ACK2, and S129ACK2+ATP) were immunoblotted with polyclonal anti-αSyn antibody D119 and monoclonal anti-pSer129-αSyn antibody. Molecular mass markers are indicated in kilodaltons (kDa) on the left side of each panel. The arrows indicate the top of the stacking gel. c RT-QUIC samples (WTCK2, WTCK2+ATP, S129ACK2, and S129ACK2+ATP) were subjected to FTIR analysis. d Samples were examined by TEM. Bars, 50 nm. e Seeding activity of RT-QUIC samples (WTCK2, WTCK2+ATP, S129ACK2, and S129ACK2+ATP) was evaluated at dilutions from 2 × 10−4 to 2 × 10−8 by subsequent testing by RT-QUIC. The colored curves represent the kinetics of ThT fluorescence averaged over replicate wells (n  =  3 – 6). f The values of maximal fluorescence intensities and lag phase obtained in individual samples after 72-h reaction are plotted on the left and right graphs, respectively. Lag phase was defined as the time required to reach a fluorescence intensity > 120 arbitrary units. The horizontal bars indicate means  ±  standard deviation. The data for maximal fluorescence intensities were analyzed by one-way ANOVA, followed by the Tukey–Kramer test. Analysis of the data for lag phase was performed by the log-rank and the Tukey–Kramer tests. **P  <  0.01 (compared with 2 × 10−4 dilution of WT-mock); *P  <  0.05 (compared with 2 × 10−4 dilution of WT-mock); ##P  <  0.01 (compared with the same dilution of WTCK2+ATP)

Similar articles

Cited by

References

    1. Fujiwara H, Hasegawa M, Dohmae N, et al. Alpha-synuclein is phosphorylated in synucleinopathy lesions. Nat Cell Biol. 2002;4:160–164. doi: 10.1038/ncb748. - DOI - PubMed
    1. Smith WW, Margolis RL, Li X, et al. Alpha-synuclein phosphorylation enhances eosinophilic cytoplasmic inclusion formation in SH-SY5Y cells. J Neurosci : the official journal of the Society for Neuroscience. 2005;25:5544–5552. doi: 10.1523/JNEUROSCI.0482-05.2005. - DOI - PMC - PubMed
    1. Paleologou KE, Schmid AW, Rospigliosi CC, et al. Phosphorylation at Ser-129 but not the phosphomimics S129E/D inhibits the fibrillation of alpha-synuclein. J Biol Chem. 2008;283:16895–16905. doi: 10.1074/jbc.M800747200. - DOI - PMC - PubMed
    1. Chen L, Feany MB. Alpha-synuclein phosphorylation controls neurotoxicity and inclusion formation in a Drosophila model of Parkinson disease. Nat Neurosci. 2005;8:657–663. doi: 10.1038/nn1443. - DOI - PubMed
    1. Gorbatyuk OS, Li S, Sullivan LF, et al. The phosphorylation state of Ser-129 in human alpha-synuclein determines neurodegeneration in a rat model of Parkinson disease. Proc Natl Acad Sci U S A. 2008;105:763–768. doi: 10.1073/pnas.0711053105. - DOI - PMC - PubMed