. 2017 Jun;31(6):587-602.
doi: 10.1007/s10822-017-0026-5. Epub 2017 May 26.

DFT-based prediction of reactivity of short-chain alcohol dehydrogenase

Affiliations

DFT-based prediction of reactivity of short-chain alcohol dehydrogenase

I Stawoska et al. J Comput Aided Mol Des. 2017 Jun.

Abstract

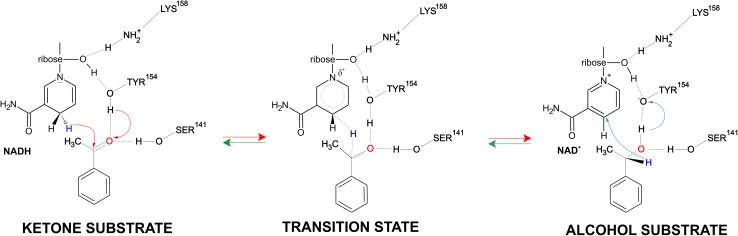
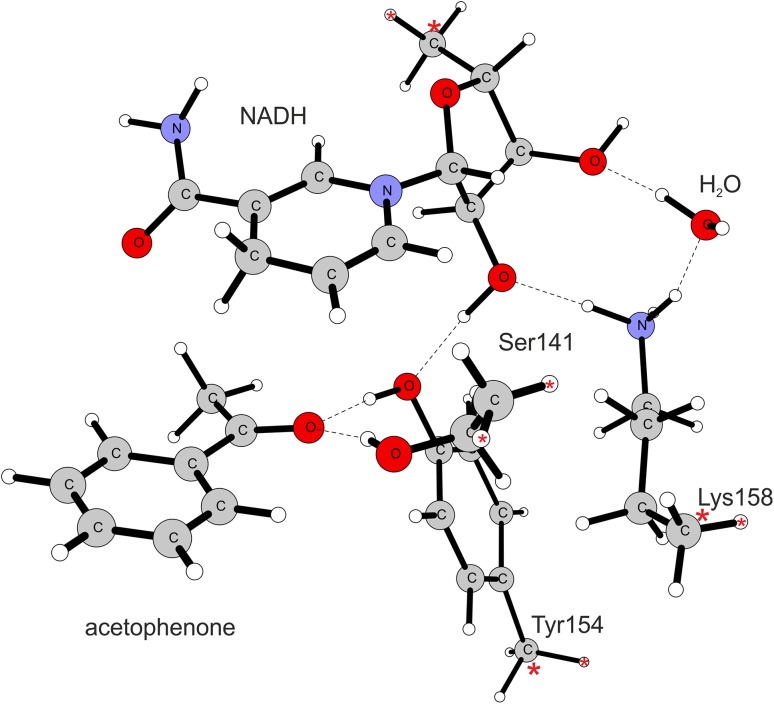
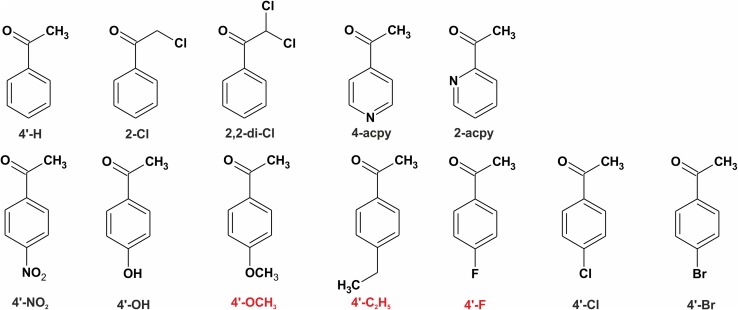
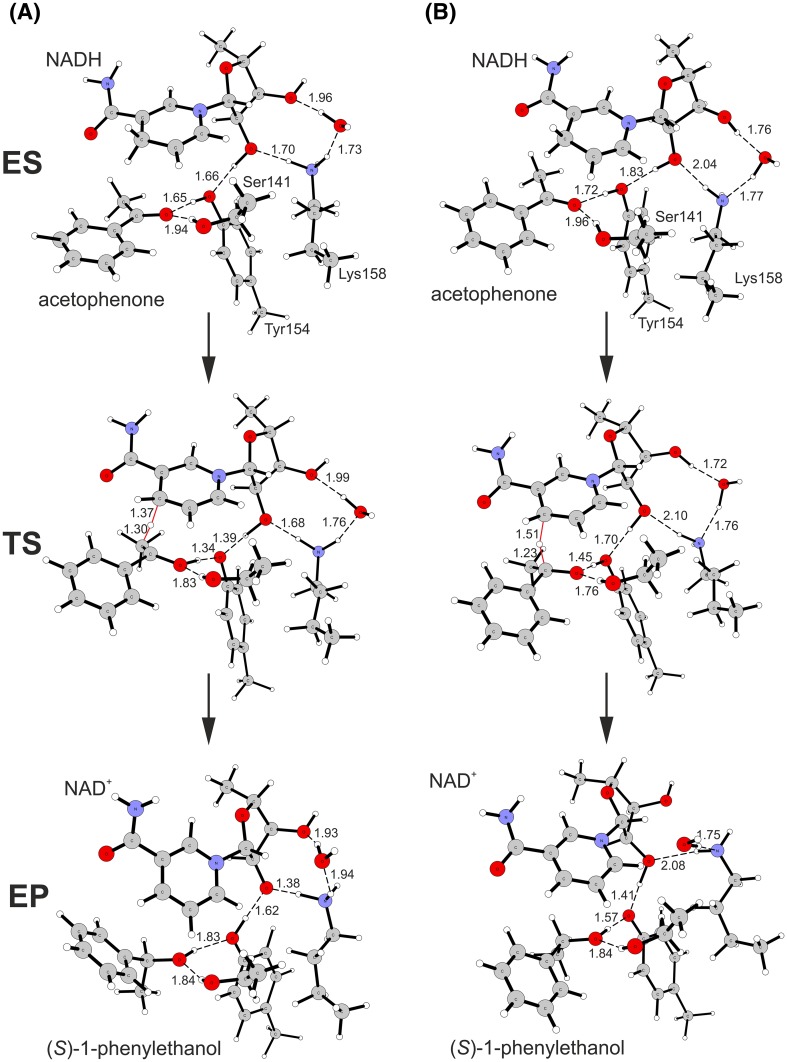
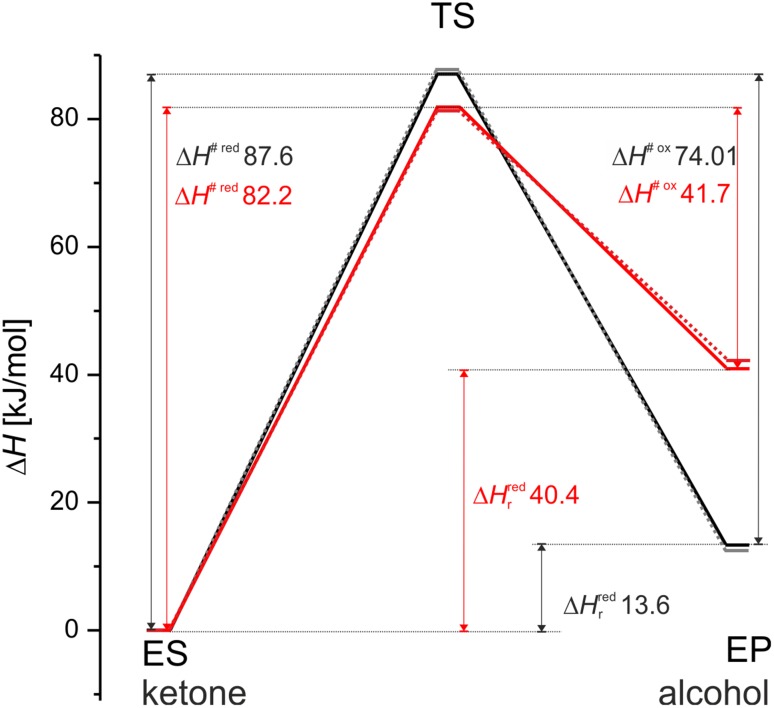
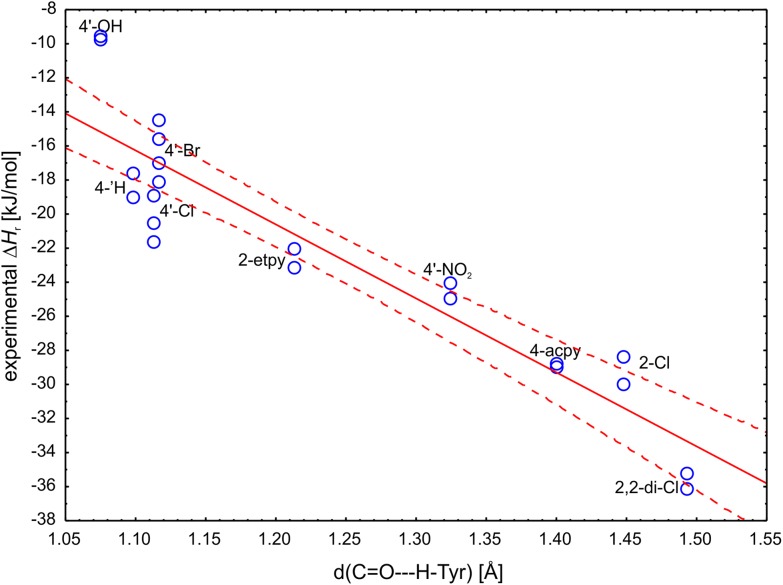
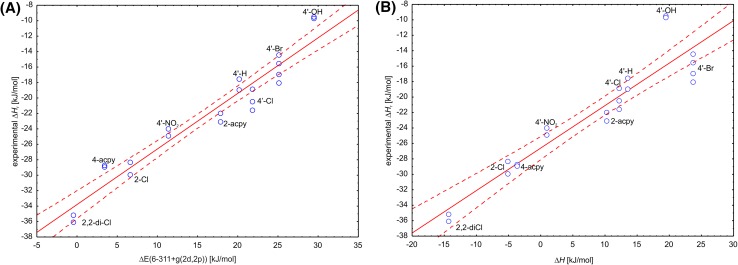
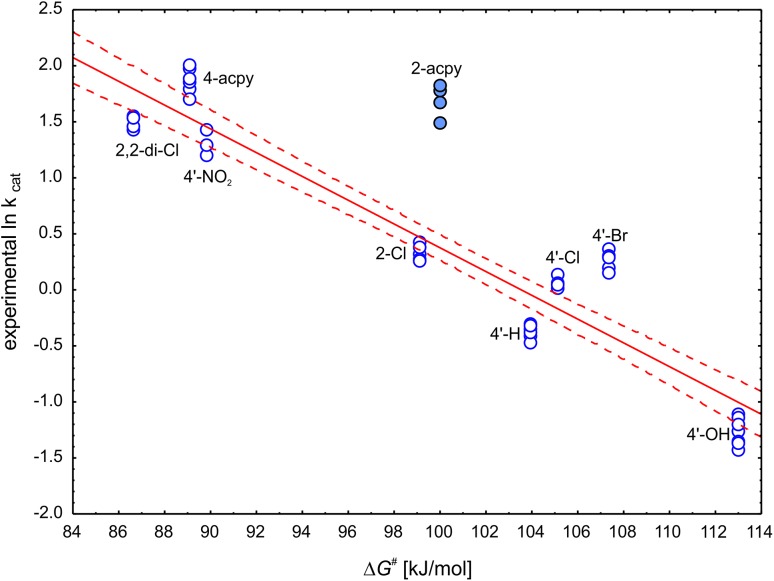
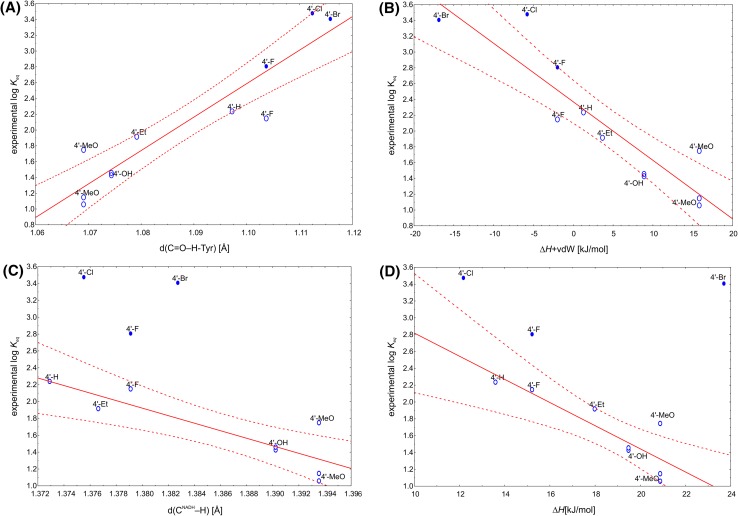
The reaction mechanism of ketone reduction by short chain dehydrogenase/reductase, (S)-1-phenylethanol dehydrogenase from Aromatoleum aromaticum, was studied with DFT methods using cluster model approach. The characteristics of the hydride transfer process were investigated based on reaction of acetophenone and its eight structural analogues. The results confirmed previously suggested concomitant transfer of hydride from NADH to carbonyl C atom of the substrate with proton transfer from Tyr to carbonyl O atom. However, additional coupled motion of the next proton in the proton-relay system, between O2' ribose hydroxyl and Tyr154 was observed. The protonation of Lys158 seems not to affect the pKa of Tyr154, as the stable tyrosyl anion was observed only for a neutral Lys158 in the high pH model. The calculated reaction energies and reaction barriers were calibrated by calorimetric and kinetic methods. This allowed an excellent prediction of the reaction enthalpies (R2 = 0.93) and a good prediction of the reaction kinetics (R2 = 0.89). The observed relations were validated in prediction of log K eq obtained for real whole-cell reactor systems that modelled industrial synthesis of S-alcohols.

Keywords: (S)-1-phenylethanol dehydrogenase; Alcohol dehydrogenase/ketoreductase; Hydride transfer; PEDH; Reduction of ketones; Short chain dehydrogenase.


Figures

Fig. 1
Fig. 1
Reaction mechanism postulated for short-chain alcohol dehydrogenase
Fig. 2
Fig. 2
The low pH cluster model (protonated Lys158). The dashed lines indicate hydrogen bonds while red asterisks mark atoms with frozen coordinates
Fig. 3
Fig. 3
PEDH substrates used in the study. The red labelled substrates were used as an external validation set
Fig. 4
Fig. 4
Reduction of acetophenone to (S)-1-phenylethanol catalysed by PEDH calculated with cluster model with B3LYP: a low pH model (protonated Lys158) and b high pH model (neutral Lys158). H-bond and crucial transition state distances were marked with dashed lines and their length provided in Å
Fig. 5
Fig. 5
Comparison of enthalpy reaction profiles calculated for low pH (black lines) and high pH (red lines) models with B3LYP (solid lines) and X3LYP (dotted lines) functionals. ΔH # red and ΔH # ox are enthalpies of activation for reduction or oxidation process, respectively, while ΔH r red are the reaction enthalpies for the reduction process
Fig. 6
Fig. 6
Correlation plot of the experimental reaction enthalpy ΔH r with C=O–H–OTyr distance (R2 = 0.8573). The solid line represents linear fit while dashed line represents 95% confidence range
Fig. 7
Fig. 7
Correlation plot of the experimental reaction enthalpy ∆H r with energetic descriptors calculated with cluster models: a ∆E(6-311+g(2d,2p)) (R2 = 0.9292) or bH (R2 = 0.8713). The solid line represents a linear fit while dashed line represents 95% confidence range
Fig. 8
Fig. 8
Correlation plot of the ln kcat with ∆G # (R2 = 0.8866). The solid line represents linear fit while dashed line represents 95% confidence range. The outlier 2-acpy (full circles) was excluded from the correlation
Fig. 9
Fig. 9
Correlation plot of the log K eq with: (A) d(C=O–H-Tyr) (R2 = 0.8728) and (B) ∆H + vdW (R2 = 0.8277) for the whole data set of the experimentally determined K eq; (C) d(CNADH–H) (R2 = 0.7494) and (D) ∆H (R2 = 0.7502) for the data set with excluded values, which were potentially overestimated (full ovals). The solid line represents linear fit while dashed line represents 95% confidence range

References

    1. Patel RN. Coordin Chem Rev. 2008;252(5–7):659–701. doi: 10.1016/j.ccr.2007.10.031. - DOI
    1. Matsuda T, Yamanaka R, Nakamura K. Tetrahedron. 2009;20(5):513–557. doi: 10.1016/j.tetasy.2008.12.035. - DOI
    1. Nakamura K, Yamanaka R, Matsuda T, Harada T. Tetrahedron. 2003;14(18):2659–2681. doi: 10.1016/S0957-4166(03)00526-3. - DOI
    1. Kaluzna IA, David Rozzell J, Kambourakis S. Tetrahedron. 2005;16(22):3682–3689. doi: 10.1016/j.tetasy.2005.10.002. - DOI
    1. Patel RN. Biomolecules. 2013;3(4):741–777. doi: 10.3390/biom3040741. - DOI - PMC - PubMed

LinkOut - more resources