

Testing for differentially expressed genetic pathways with single-subject N-of-1 data in the presence of inter-gene correlation
- PMID: 28552011
- PMCID: PMC5554097
- DOI: 10.1177/0962280217712271
Testing for differentially expressed genetic pathways with single-subject N-of-1 data in the presence of inter-gene correlation
Abstract
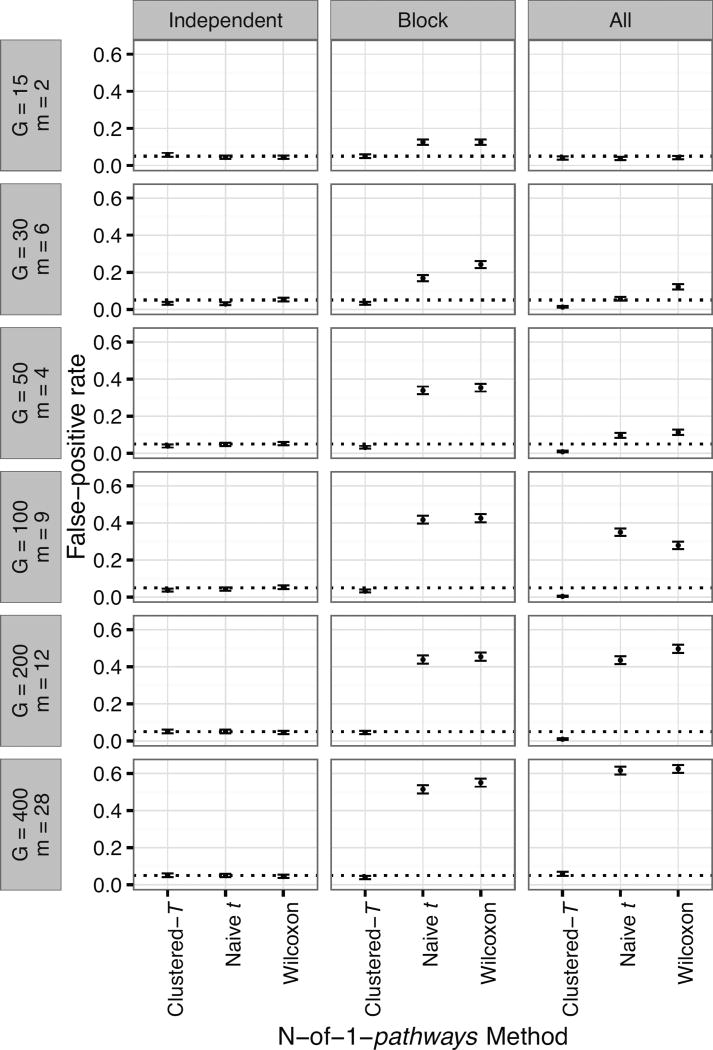
Modern precision medicine increasingly relies on molecular data analytics, wherein development of interpretable single-subject ("N-of-1") signals is a challenging goal. A previously developed global framework, N-of-1- pathways, employs single-subject gene expression data to identify differentially expressed gene set pathways in an individual patient. Unfortunately, the limited amount of data within the single-subject, N-of-1 setting makes construction of suitable statistical inferences for identifying differentially expressed gene set pathways difficult, especially when non-trivial inter-gene correlation is present. We propose a method that exploits external information on gene expression correlations to cluster positively co-expressed genes within pathways, then assesses differential expression across the clusters within a pathway. A simulation study illustrates that the cluster-based approach exhibits satisfactory false-positive error control and reasonable power to detect differentially expressed gene set pathways. An example with a single N-of-1 patient's triple negative breast cancer data illustrates use of the methodology.
Keywords: Gene expression data; N-of-1; RNA-seq; affinity propagation clustering; exemplar learning; gene set; inter-gene correlation; precision medicine; single-subject inference; triple negative breast cancer.
Conflict of interest statement
The authors declare no conflicts of interest.
Figures


Similar articles
-
Dynamic changes of RNA-sequencing expression for precision medicine: N-of-1-pathways Mahalanobis distance within pathways of single subjects predicts breast cancer survival.Bioinformatics. 2015 Jun 15;31(12):i293-302. doi: 10.1093/bioinformatics/btv253. Bioinformatics. 2015. PMID: 26072495 Free PMC article.
-
kMEn: Analyzing noisy and bidirectional transcriptional pathway responses in single subjects.J Biomed Inform. 2017 Feb;66:32-41. doi: 10.1016/j.jbi.2016.12.009. Epub 2016 Dec 19. J Biomed Inform. 2017. PMID: 28007582 Free PMC article.
-
Modifying SAMseq to account for asymmetry in the distribution of effect sizes when identifying differentially expressed genes.Stat Appl Genet Mol Biol. 2017 Nov 27;16(5-6):291-312. doi: 10.1515/sagmb-2016-0037. Stat Appl Genet Mol Biol. 2017. PMID: 29077555
-
Bayesian normalization and identification for differential gene expression data.J Comput Biol. 2005 May;12(4):391-406. doi: 10.1089/cmb.2005.12.391. J Comput Biol. 2005. PMID: 15882138 Review.
-
UGM: a more stable procedure for large-scale multiple testing problems, new solutions to identify oncogene.Theor Biol Med Model. 2019 Dec 23;16(1):20. doi: 10.1186/s12976-019-0117-1. Theor Biol Med Model. 2019. PMID: 31865918 Free PMC article. Review.
Cited by
-
Accounting for extra-binomial variability with differentially expressed genetic pathway data: a collaborative bioinformatic study.Stat (Int Stat Inst). 2023 Jan-Dec;12(1):e518. doi: 10.1002/sta4.518. Epub 2022 Oct 24. Stat (Int Stat Inst). 2023. PMID: 37885703 Free PMC article.
-
A Single-Subject Method to Detect Pathways Enriched With Alternatively Spliced Genes.Front Genet. 2019 May 9;10:414. doi: 10.3389/fgene.2019.00414. eCollection 2019. Front Genet. 2019. PMID: 31143202 Free PMC article.
-
'Single-subject studies'-derived analyses unveil altered biomechanisms between very small cohorts: implications for rare diseases.Bioinformatics. 2021 Jul 12;37(Suppl_1):i67-i75. doi: 10.1093/bioinformatics/btab290. Bioinformatics. 2021. PMID: 34252934 Free PMC article.
-
Evaluating single-subject study methods for personal transcriptomic interpretations to advance precision medicine.BMC Med Genomics. 2019 Jul 11;12(Suppl 5):96. doi: 10.1186/s12920-019-0513-8. BMC Med Genomics. 2019. PMID: 31296218 Free PMC article.
-
Emergence of pathway-level composite biomarkers from converging gene set signals of heterogeneous transcriptomic responses.Pac Symp Biocomput. 2018;23:484-495. Pac Symp Biocomput. 2018. PMID: 29218907 Free PMC article.
References
-
- van't Veer LJ, et al. Gene expression profiling predicts clinical outcome of breast cancer. Nature. 2002;415:530–536. - PubMed
Publication types
MeSH terms
Grants and funding
LinkOut - more resources
Full Text Sources
Other Literature Sources
