Review
. 2017 May:100:1-16.
doi: 10.1016/j.pnmrs.2017.01.001. Epub 2017 Jan 11.

Beyond the paradigm: Combining mass spectrometry and nuclear magnetic resonance for metabolomics

Affiliations
Review

Beyond the paradigm: Combining mass spectrometry and nuclear magnetic resonance for metabolomics

Darrell D Marshall et al. Prog Nucl Magn Reson Spectrosc. 2017 May.

Abstract

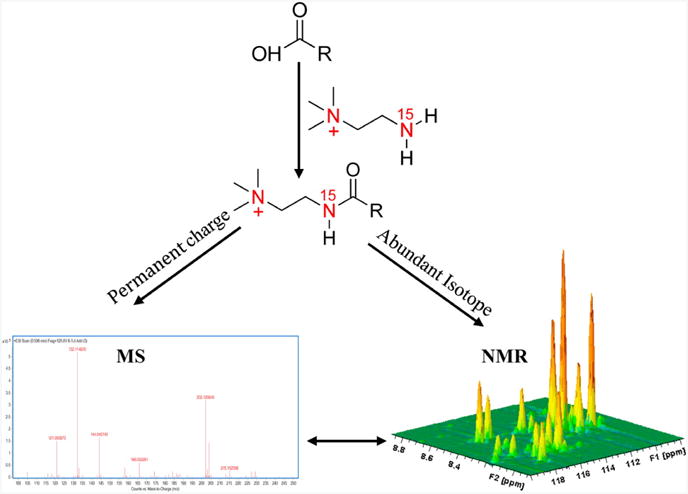
Metabolomics is undergoing tremendous growth and is being employed to solve a diversity of biological problems from environmental issues to the identification of biomarkers for human diseases. Nuclear magnetic resonance (NMR) and mass spectrometry (MS) are the analytical tools that are routinely, but separately, used to obtain metabolomics data sets due to their versatility, accessibility, and unique strengths. NMR requires minimal sample handling without the need for chromatography, is easily quantitative, and provides multiple means of metabolite identification, but is limited to detecting the most abundant metabolites (⩾1μM). Conversely, mass spectrometry has the ability to measure metabolites at very low concentrations (femtomolar to attomolar) and has a higher resolution (∼103-104) and dynamic range (∼103-104), but quantitation is a challenge and sample complexity may limit metabolite detection because of ion suppression. Consequently, liquid chromatography (LC) or gas chromatography (GC) is commonly employed in conjunction with MS, but this may lead to other sources of error. As a result, NMR and mass spectrometry are highly complementary, and combining the two techniques is likely to improve the overall quality of a study and enhance the coverage of the metabolome. While the majority of metabolomic studies use a single analytical source, there is a growing appreciation of the inherent value of combining NMR and MS for metabolomics. An overview of the current state of utilizing both NMR and MS for metabolomics will be presented.


Figures

Figure 1
Figure 1
The chart plots the number of MS metabolomics (green), NMR metabolomics (blue), and combined NMR and MS metabolomics (red) studies published per year from 2001 to 2016. These data were obtained from a keyword search of all documents on PubMed using the key words “MS and metabolomics”, “NMR and metabolomics”, or “MS and NMR and metabolomics”.
Figure 2
Figure 2
Illustration of the metabolomics work flow that combines advanced NMR spectroscopy techniques with multivariate statistics. Samples are collected in a uniform way to minimize variability and are analyzed by NMR profile to collect data on all metabolites potentially present in the sample. Pattern recognition approaches (PRA) include principal component analysis, partial least squares discriminant analysis, orthogonal projections to latent structures, heat map, support vector machines, and random forests method, and other modes aiming to highlight underlying trends and visualization tools such as contribution. Trend and box plots are used to further evaluate these. Receiver operating characteristic (ROC) curves are generally considered the method of choice for evaluating the performance of potential biomarkers. The markers are eventually placed in a metabolic pathway to provide insight on the biochemical phenomena. (Samples) Multiple replicate samples are obtained from cells, tissues, or biofluids (e.g., urine, plasma, etc.) for each group (e.g., healthy vs. disease). (NMR profile) A 1D 1H NMR spectrum is collected for each metabolomics sample, which becomes the data set. A mass spectrum can be used instead or in addition to the NMR spectrum. (PRA) Illustrations of typical multivariate statistical analysis of the metabolomics NMR data set. Clockwise from upper-left, a scores plot from a PCA model indicating two distinct clusters or groups are present in the data set. A heatmap shows the clustering of metabolite changes (x-axis) relative to each group replicate (y-axis). The relative color of each bin corresponds to the metabolite concentration difference between replicates. The heatmap identifies which set of metabolites are uniquely changing between each group. The result of a random forest classification is summarized by plotting the out-of-bag error rate or misclassifications versus the number of trees. The results indicate that the healthy and disease groups can be separated with an error rate of < 5% with a nominal number of trees. A back-scaled loadings plot, which is a pseudo 1D 1H NMR spectrum, is generated from an OPLS model. The relative intensity and direction of each peak conveys the importance and correlation of the NMR peak to the observed group separation in the corresponding scores plot. (ROC) Illustrations of the validation and the further analysis of the key metabolites identified from the multivariate statistical analysis that define the group separation. On the left is a ROC curve, which plots sensitivity (true positive rate) versus 1-specificity (false positive rate). The area under the curve is a measure of the accuracy of the model to correctly predict group membership. On the right is the pathway topology analysis produced by MetPA (http://metpa.metabolomics.ca) from the list of metabolites identified by the multivariate statistical analysis. MetPA assists in identifying the set of important metabolic pathways associated with the phenotype. (Pathways) Illustration of metabolic networks or signaling pathways identified from the observed metabolomic changes between the groups. Reproduced with permission from reference [86].
Figure 3
Figure 3
A) Scatter plot representing the area of each feature from the XCMS matrix of LC/MS data of liver samples reconstituted in H2O and D2O. A correlation coefficient (R2) of 0.997 indicates a high linear regression, which demonstrates that differences between the number and abundance of features detected in liver extracts reconstituted in H2O and D2O are insignificant. (B) Mass spectra of phenylalanine, tryptophan, and LysoPC (16:0) reconstituted in D2O (top) and H2O (bottom). Labile hydrogens are marked in red. Mass spectra show that the isotopic distributions of the compounds are not altered by D2O, indicating either slow H/D exchange of acidic protons in solution or fast back-exchange of labile deuterons in aqueous LC/MS buffers due to a total solvent accessibility of small molecule structures. Reproduced with permission from reference [101].
Figure 4
Figure 4
Schematic figure illustrating the “smart isotope tag” approach used to detect the same metabolites using NMR and MS with high sensitivity. Tagging carboxyl-containing metabolites with 15N-cholamine enables their enhanced detection by both NMR and MS. Reproduced with permission from reference [30].
Figure 5
Figure 5
Metabolic model of liver acetate oxidative metabolism used to estimate hepatic TCA cycle flux (VTCA) and anaplerosis (VANA). Carbon positional enrichment denoted in red occurs during the initial incorporation of label from 1-13C-acetate to glutamate on the first pass through the TCA cycle. Positional enrichment denoted in blue occurs during the 2nd pass through the TCA cycle, with label originating from internal scrambling at succinate or from bicarbonate (HCO3)/13CO2 via anaplerosis. Reproduced with permission from reference [145].
Figure 6
Figure 6
High resolution NMR spectra of a methanolic extract of LCC2 cells. Glycerophospholipids were extracted from LCC2 cells grown in the presence of 10 mM [U-13C]-glucose for 24 h. (A) 1D 1H NMR spectrum and (B) TOCSY spectrum. The TOCSY spectrum was recorded at 18.8 T 293 K with 50 ms mixing time at a B1 field strength of 9 kHz. The data were processed with one linear prediction and zerofilling in t1 and apodized using an unshifted Gaussian function in both dimensions. (C) 1D 1H NMR spectra, top: 1D 13C-edited 1H (HSQC) spectrum, bottom: high resolution 1H NMR spectrum. High resolution FT-ICR mass spectrum of a methanolic extract of LCC2 cells. (D) FT-ICR-MS profile spectrum of an LCC2 methanol extract after 24 h labeling with [U-13C]-glucose. A close up of the m/z region from 760 to 782 is shown. The accurate masses (better than 1 ppm) at high resolution (>100,000 at measured mass) enable assignment of the GPLs and their isotopologues. Masses were externally calibrated, and secondarily calibrated with respect to internal standard reserpine; intensities have been arbitrarily scaled to 100 units for m0 at m/z = 760.5860. (E) Mass distribution of PC 34:1 normalized to the total intensity as a function of time. The distribution at 0 h is indistinguishable from the expected natural abundance intensity. Line graphs are used here for clarity only; no values are implied between data points. (F) Time courses of selected mass peaks. (■) m0, (□) m0+3, (•) Σ(m0+2n); (○) Σ(m0+3+2n). The m0+3 intensities were fitted to a(1-exp(−kt)) with a = 0.11 ± 0.008 and k = 0.19 ± 0.04 h−1 . Reproduced with permission from reference [124].
Figure 7
Figure 7
Schematic representation of the SUMMIT MS/NMR strategy for the identification of metabolites in complex metabolomic mixtures by the combined use of mass spectrometry and 1D 1H NMR spectroscopy. High-resolution MS yields the unique molecular formulas of the metabolites present in the mixture (left). For each molecular formula, all possible structures are generated, representing the total structural manifold depicted as the sum of the three local manifolds (green, red, blue; middle), each belonging to a different mass. Next, NMR chemical shifts are predicted for all manifold structures. Comparison of the predicted with the experimental NMR chemical shifts (right) allows identification of the structures that are present in the mixture, requiring neither an NMR nor an MS metabolomics database [28, 29, 58]. Reproduced with permission from reference [29].
Figure 8
Figure 8
Scores generated from (A) PCA of 1H NMR, (B) PCA of DI-ESI-MS, and (C) MB-PCA of 1H NMR and DI-ESI-MS. Separations between classes are greatly increased upon combination of the two data sets via MB-PCA. Symbols designate the following classes: Control ( formula image), Rotenone ( formula image), 6-OHDA ( formula image), MPP+ ( formula image), and Paraquat ( formula image
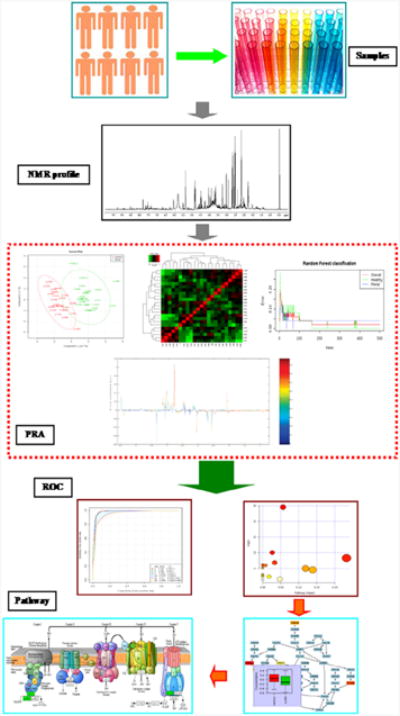
). Corresponding dendrograms are shown in (D-F). The statistical significance of each node in the dendrogram is indicated by a p value. Reproduced with permission from reference [57].

References

    1. Wachtel-Galor S, Benzie IFF. Herbal Medicine: An Introduction to Its History, Usage, Regulation, Current Trends, and Research Needs. 2011 - PubMed
    1. Oliver SG, Winson MK, Kell DB, Baganz F. Systematic functional analysis of the yeast genome. Trends Biotechnol. 1998;16:373–378. - PubMed
    1. Nicholson JK, Lindon JC, Holmes E. ‘Metabonomics’: understanding the metabolic responses of living systems to pathophysiological stimuli via multivariate statistical analysis of biological NMR spectroscopic data. Xenobiotica. 1999;29:1181–1189. - PubMed
    1. Fiehn O. Combining genomics, metabolome analysis, and biochemical modelling to understand metabolic networks. Comp Funct Genomics. 2001;2:155–168. - PMC - PubMed
    1. Dunn WB, Bailey NJ, Johnson HE. Measuring the metabolome: current analytical technologies. Analyst. 2005;130:606–625. - PubMed

Publication types