. 2017 Jun 1;169(6):1119-1129.e11.
doi: 10.1016/j.cell.2017.05.002. Epub 2017 May 25.

Regulatory T Cells in Skin Facilitate Epithelial Stem Cell Differentiation

Affiliations

Regulatory T Cells in Skin Facilitate Epithelial Stem Cell Differentiation

Niwa Ali et al. Cell. .

Abstract

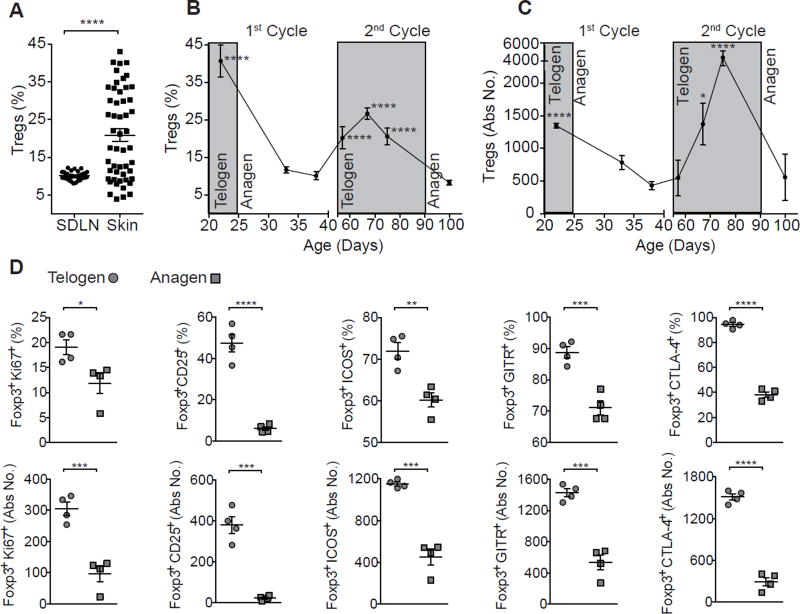
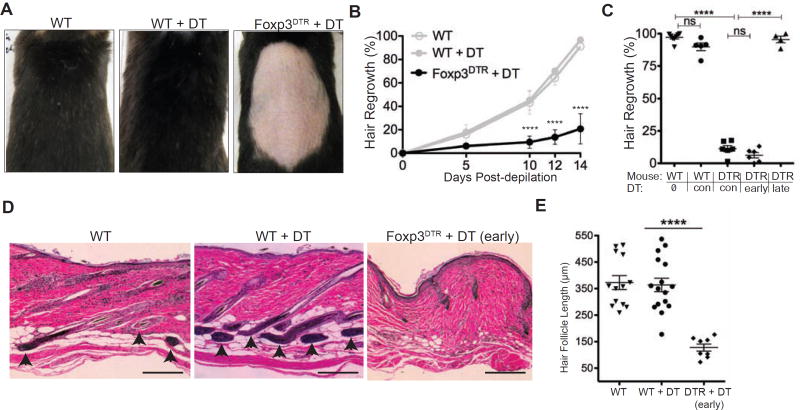
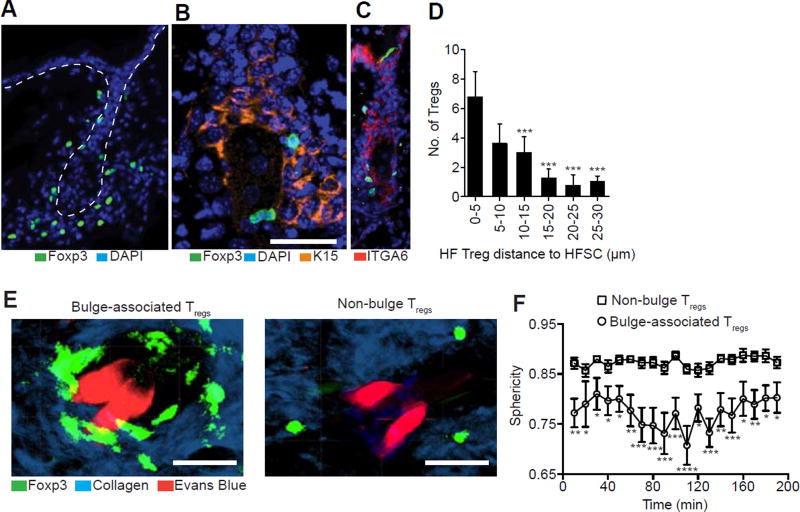
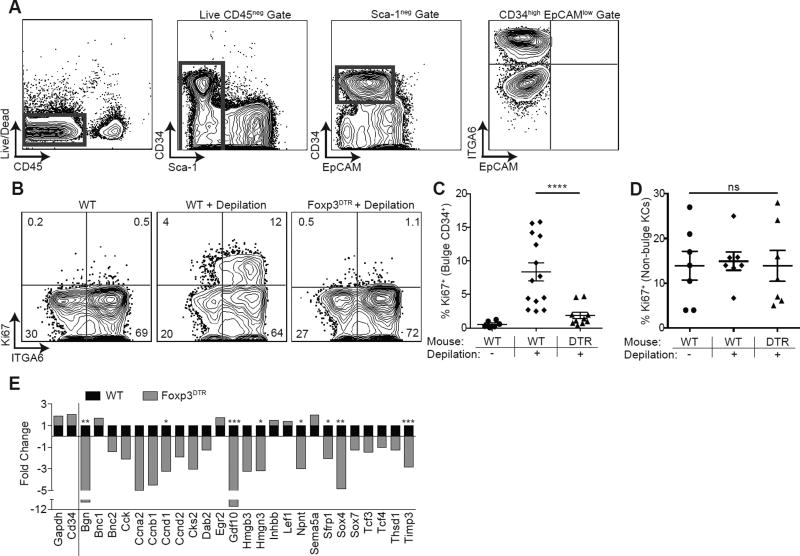
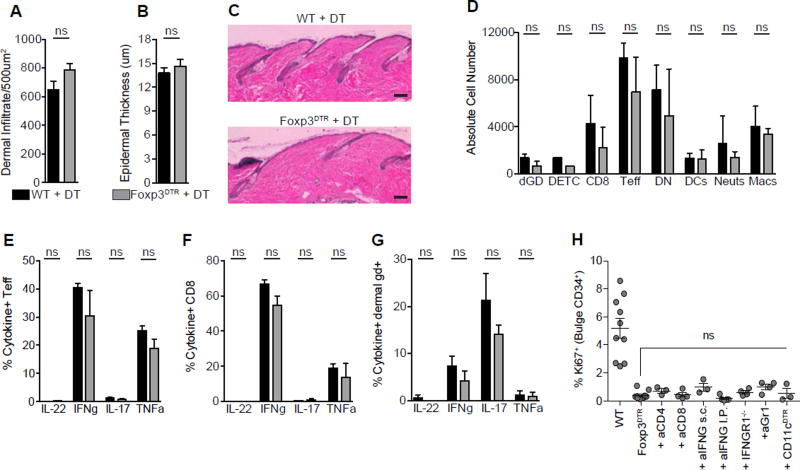
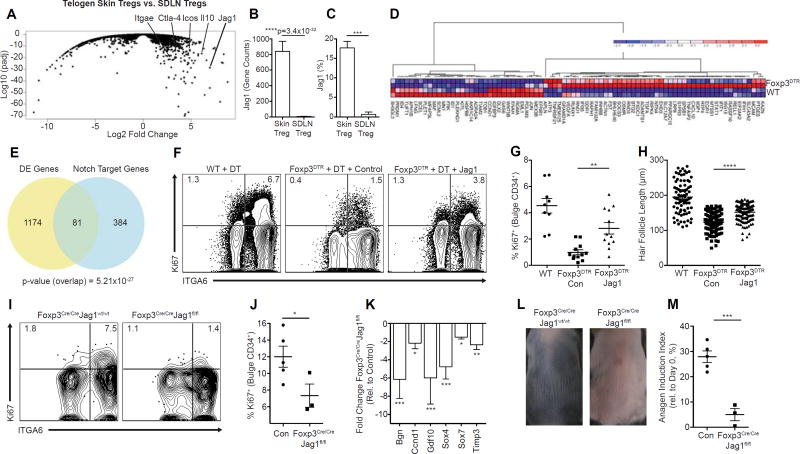
The maintenance of tissue homeostasis is critically dependent on the function of tissue-resident immune cells and the differentiation capacity of tissue-resident stem cells (SCs). How immune cells influence the function of SCs is largely unknown. Regulatory T cells (Tregs) in skin preferentially localize to hair follicles (HFs), which house a major subset of skin SCs (HFSCs). Here, we mechanistically dissect the role of Tregs in HF and HFSC biology. Lineage-specific cell depletion revealed that Tregs promote HF regeneration by augmenting HFSC proliferation and differentiation. Transcriptional and phenotypic profiling of Tregs and HFSCs revealed that skin-resident Tregs preferentially express high levels of the Notch ligand family member, Jagged 1 (Jag1). Expression of Jag1 on Tregs facilitated HFSC function and efficient HF regeneration. Taken together, our work demonstrates that Tregs in skin play a major role in HF biology by promoting the function of HFSCs.

Keywords: Jagged 1; Notch; alopecia areata; hair; hair follicle stem cell; hair regeneration; regulatory T cell; skin.


Figures

Figure 1
Figure 1. Treg accumulation and activation in skin correlates with the HF Cycle
(A) Treg cell abundance in skin draining lymph nodes (SDLNs) and skin of adult 4–14 week old WT mice as measured by flow cytometry. Pre-gated on live CD45+CD3+CD4+ cells. Flow cytometric profiling of Treg (B) frequency and (C) absolute numbers from dorsal skin of C57BL/6 mice at specific stages of the synchronous HF cycle (n = 5–12 mice per time point). Shaded areas represent telogen phase and unshaded areas represent anagen phase. Treg associated activation markers were assessed: CD25, ICOS, Ki67, CTLA-4, and GITR. (D) Summary of percent and absolute cell number (Abs No.) quantification of Treg activation marker expression in telogen and anagen skin. One representative experiment of three is shown. Data are mean ± s.e.m. *P<0.05, **P<0.01 ***P<0.001, ****P<0.0001; One-way ANOVA 1st telogen vs 1st anagen and 2nd telogen vs 2nd anagen (B, C), Student’s unpaired t-test (D). See also Figure S1.
Figure 2
Figure 2. Tregs are required for hair regeneration
Foxp3DTR mice or control WT mice were treated with DT on days −2, −1, and depilated on day 0 to induce anagen. DT administration was continued from Day 1 and then every other day until the termination of the experiment at day 14. (A) Representative photos and (B) kinetics of hair regrowth in WT and Treg depleted (Foxp3DTR) mice (n = 3–4 mice per group). Tregs were depleted either up to day 4 (early), from day 7 onwards (late) or constitutively (con) throughout the experimental period. (C) Hair regrowth at day 14 in WT and Foxp3DTR mice with DT treatments as indicated. (D), Representative H&E staining of skin from WT and Foxp3DTR mice on day 14. Arrows indicate anagen HF extension into dermal adipose. Scale Bars, 100 µ m. (E), Quantification of HF length on day 14. Data are mean ± s.e.m. ****P<0.0001, ns = not significant; One-way ANOVA (B, C, E). Foxp3DTR + DT vs WT + DT (B). See also Figure S2.
Figure 3
Figure 3. Tregs in skin preferentially reside in close approximation to HFSCs
(A) Representative immunofluorescent image of Foxp3+ Tregs in telogen skin of Foxp3GFP reporter mice. Dashed line indicates outline of HF. ‘B’ indicates bulge region. Treg cell co-staining with (B) Keratin-15 (K15) and (C) integrin-alpha 6 (ITGA6). (D) Quantification of follicular Treg distance to bulge HFSCs. Data are combined counts from >10 sections. (E) Maximal intensity projection profiles of bulge-associated and non-bulge associated Tregs from intravital imaging of Foxp3GFP mice compiled from images recorded every 10 minutes during a 200 min time-lapse. HF Vasculature is labelled with Evans Blue dye (red). (F) Quantification of cell sphericity between bulge-associated and non-bulge associated Tregs during a 200 min time-lapse. Scale Bars, 50 µm. Data are mean ± s.e.m. *P<0.05, **P<0.01 ***P<0.001, ****P<0.001; One-way ANOVA, 0–5 µm vs. all other groups (D); Two-way ANOVA, bulge- vs. non-bulge Tregs at each respective time-point (F). One representative experiment of three with n = 3 mice total. See also Figure S3.
Figure 4
Figure 4. Tregs are required for HFSC proliferation and differentiation
(A) Flow cytometric gating strategy to identify CD34+ integrin α6high (ITGA6) bulge HFSCs. Foxp3DTR mice or control mice were treated with DT on days −2, −1, depilated on day 0 to induce anagen and DT administered again on days 1 and 3 (i.e., early regimen). (B) Representative flow cytometric plots of Ki67 expression in bulge HFSCs between WT and FoxpDTR mice 4 days after depilation. (C) Flow cytometric quantification of Ki67+ bulge HFSCs and (D) non-bulge keratinocytes 4 days after depilation. RNA sequencing was performed on FACS purified bulge HFSCs at day 4 post-depilation from control (WT) or Treg depleted (Foxp3DTR) mice. (E) Fold change in HFSC differentiation genes in WT and FoxpDTR mice, expressed as fold change relative to WT (where a value of 1 = no change). Genes to the left of the solid line represent control genes. Significance values are calculated based on transcript expression level. Data are mean ± s.e.m. *P<0.05, **P<0.01 ***P<0.001, **** P<0.0001, ns = no significant difference, One-way ANOVA (C and D); RNA-Seq Differential Expression analysis, WT vs. Foxp3DTR for each respective gene (E). See also Figure S4.
Figure 5
Figure 5. Transient Treg loss results in minimal skin inflammation
Control wild-type (WT) or Foxp3DTR mice were depilated and treated with DT according to the ‘early’ depletion protocol. (A) Total dermal infiltrate and (B) epidermal hyperplasia in DT treated control (WT + DT) and Tregs depleted (Foxp3DTR + DT) dorsal skin on day 4 as measured by routine histology. (C) Representative H&E staining of skin from WT and Foxp3DTR mice on day 4. (D) The absolute cell number of innate and adaptive immune cell subsets in skin as measured by flow cytometry. Single cell suspensions from day 1 skin were stimulated with PMA/ionomycin and the production of IL-22, IFNg, IL-17 and TNFalpha was assessed by flow cytometry. The proportion of cytokine producing (E) CD4+ Teff Cells, (F) CD8+ T cells, and (G) dermal γδ+ T cells in dorsal skin. (H) Flow cytometric quantification of Ki67+ bulge HFSCs at day 4 post-depilation in immune cell depleted and interferon-γ neutralized (or interferon-γ signaling deficient) mice. Scale Bars, 50 µm. Data are mean ± s.e.m. ns = no significant difference, Unpaired Student’s t-test (A, B); Two-way ANOVA (D–G); One-way ANOVA (H). Combined data from two experiments, with n = 3–4 mice per group. See also Figure S5.
Figure 6
Figure 6. Treg expression of Jagged-1 (Jag1) is required for efficient HFSC activation and anagen induction
RNA sequencing was performed on telogen skin Tregs and Tregs isolated from SDLNs. (A) Volcano plot comparing expression profile of skin versus SDLN Tregs. (B) Raw gene counts of Jag1 transcripts as quantified by RNA sequencing (n = 4 for skin Tregs and n = 3 for SDLN Tregs). (C) Flow cytometric quantification of Jag1 expression on SDLN Tregs and skin Tregs (n = 4 for both skin and SDLN Tregs). RNA sequencing was performed on FACS purified bulge HFSCs at day 4 post-depilation from control (WT) or Treg depleted (Foxp3DTR) mice. (D) Hierarchial clustering of differential expression of Notch target genes in HFSCs sequenced from control (WT) and Treg depleted (DTR) mice, depicted as a heat map (E) Venn diagram depicting the overlap between the total differentially expressed (DE) genes and known Notch target genes. P-value represents the significance of the overlap as determined by a chi-squared test. Jag1-Fc coated or control Fc coated beads were administered subcutaneously in Treg depleted mice on days −2, −1, 1 and 3. All mice were depilated on day 0. (F) Representative flow cytometric plots 4 days post-depilation gated on HFSCs from WT and Foxp3DTR mice treated with control or Jag1-Fc coated beads. (G) Quantification of Ki67+ bulge HFSCs and (H) HF length 4 days post-depilation. Control (i.e., Foxp3Cre/CreJag1wt/wt) or Foxp3Cre/CreJag1fl/fl mice were depilated to induce anagen. (I) Representative flow cytometric plots and (J) quantification of Ki67+ bulge HFSCs. (K) Fold change in HFSC differentiation genes as measured by qRT-PCR. (L) Representative photos and (M) quantification of skin pigmentation. RNA-Seq experiments were conducted using 2–4 biological samples (A, D, and E). Data are combined from three independent experiments (F–H). One representative experiment of two (I–M). Data are mean ± s.e.m. *P<0.05, **P<0.01 ***P<0.001, ****P<0.001, RNA-Seq Differential Expression analysis, Skin Tregs vs. SDLN Tregs (B); Unpaired t-test (C, J, and M) ; One-way ANOVA (G, H, and K). See also Figure S6.

Comment in

References

    1. Anders S, Huber W. Differential expression analysis for sequence count data. Genome Biol. 2010;11:R106. - PMC - PubMed
    1. Anders S, Pyl PT, Huber W. HTSeq--a Python framework to work with high-throughput sequencing data. Bioinforma. Oxf. Engl. 2015;31:166–169. - PMC - PubMed
    1. Arpaia N, Green JA, Moltedo B, Arvey A, Hemmers S, Yuan S, Treuting PM, Rudensky AY. A Distinct Function of Regulatory T Cells in Tissue Protection. Cell. 2015;162:1078–1089. - PMC - PubMed
    1. Blanpain C, Fuchs E. Epidermal homeostasis: a balancing act of stem cells in the skin. Nat. Rev. Mol. Cell Biol. 2009;10:207–217. - PMC - PubMed
    1. Blanpain C, Lowry WE, Pasolli HA, Fuchs E. Canonical notch signaling functions as a commitment switch in the epidermal lineage. Genes Dev. 2006;20:3022–3035. - PMC - PubMed

Substances