. 2017 Jun 5;27(11):1561-1572.e8.
doi: 10.1016/j.cub.2017.04.051. Epub 2017 May 25.

Modular Segregation of Structural Brain Networks Supports the Development of Executive Function in Youth

Affiliations

Modular Segregation of Structural Brain Networks Supports the Development of Executive Function in Youth

Graham L Baum et al. Curr Biol. .

Abstract

The human brain is organized into large-scale functional modules that have been shown to evolve in childhood and adolescence. However, it remains unknown whether the underlying white matter architecture is similarly refined during development, potentially allowing for improvements in executive function. In a sample of 882 participants (ages 8-22) who underwent diffusion imaging as part of the Philadelphia Neurodevelopmental Cohort, we demonstrate that structural network modules become more segregated with age, with weaker connections between modules and stronger connections within modules. Evolving modular topology facilitates global network efficiency and is driven by age-related strengthening of hub edges present both within and between modules. Critically, both modular segregation and network efficiency are associated with enhanced executive performance and mediate the improvement of executive functioning with age. Together, results delineate a process of structural network maturation that supports executive function in youth.

Keywords: DTI; MRI; adolescence; brain; connectome; development; executive; module; network; tractography.


Figures

Figure 1
Figure 1. Executive functioning improves with age
(A) Age distribution of 882 youth completing diffusion imaging as part of the PNC. (B) Executive performance on a neurocognitive battery improves with age (n=880). Blue line represents the best fit from a general additive model; shaded area indicates 95% confidence interval.
Figure 2
Figure 2. Connectome construction
For each subject, the T1 image was processed using FreeSurfer and parcellated into 234 network nodes on an individualized basis. Deterministic streamline tractography was used to create a symmetric adjacency matrix (234×234), where the edge weight was defined as the mean fractional anisotropy (FA) along the connecting streamlines. Network nodes were each assigned to one of the seven large-scale functional modules defined by Yeo et al. [6]; subcortical nodes were assigned to an eighth module. VIS=visual, SOM=somatomotor, DOR=dorsal attention, VEN=ventral attention, LIM=limbic, FPC=frontoparietal control, DMN= default mode network, SUB=subcortical.
Figure 3
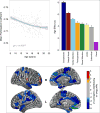
Figure 3. Structural brain network modules become increasingly segregated with age
Modular segregation was quantified as the mean participation coefficient across all network nodes, with lower values indicating more segregation. (A) Mean participation coefficient values declined significantly with age. (B) Modular segregation is differentially distributed across functional systems. Age-related modular segregation is most robust in the somatomotor and default mode systems, but also present in other networks. (C) Age-related changes in participation coefficient provide convergent results for individual nodes, and demonstrate widespread declines with age, particularly within default mode regions such as the posterior cingulate. Two exceptions to this overall trend were the right rostral frontal gyrus and frontal operculum, where participation coefficient increased with age. Blue line represents the best fit from a general additive model; shaded area indicates 95% confidence interval. Color palette represents z-transformed p-values from a general additive model. Images are thresholded to control for multiple comparisons using the False Discovery Rate (q<0.05). *indicates p<0.001. See also Figures S1, S3, S6, S7, and Table S1.
Figure 4
Figure 4. Modular segregation is driven by a combination of both enhanced within-module connectivity and reduced between-module connectivity
(A) Average strength of within-module connectivity increases with age. (B) Between-module connectivity decreases across development. (C) Convergent effects are seen at the level of individual graph edges (image thresholded using Bonferroni corrected p<0.05 for clarity). (D) A higher percentage of within-module connections (red) strengthen with age than expected by chance. * indicates p<0.001. See also Figure S1.
Figure 5
Figure 5. Results are robust to methodological choices
Regardless of specific processing decisions, an increase in modular segregation with age was observed. (A) Convergent findings result when using an index of the modularity quality for the Yeo partition [6], where higher Q indicates more segregated modules. (B) When using a group-level structural partition, modular segregation (mean participation coefficient) decreases with age. (C) Modularity quality of subject-level connectivity matrices also increases with age. (D) Results remain unaffected when a higher-dimensional parcellation is used (n=463 nodes), (E) when streamline count is used instead of FA as an edge weight, and (F) when normalized streamline density is used as the edge weight. For brain networks derived from probabilistic tractography, mean participation coefficients were integrated across a wide density range (5–60%). We observed an age-related increase in modular segregation when edge weights were defined by (G) probabilistic streamline count, (H) probabilistic streamline density, and (I) inter-regional connectivity probability. Lower participation coefficient indicates more segregated modules. Blue line represents the best fit from a general additive model; shaded area indicates 95% confidence interval. See also Figures S1, S2, S4, and S5.
Figure 6
Figure 6. Modular segregation promotes global network efficiency, and is driven by developmental strengthening of specific hub edges
(A) Replicating prior work, global network efficiency increases with age. (B) While controlling for age, lower mean participation coefficient is associated with greater network efficiency, indicating a positive association between modular segregation and network efficiency. (C) Connections that strengthen with age are enriched for hub edges (47%). Hub edges are defined as connections in the top quartile of edge betweenness centrality, which quantifies how often a given edge lies on the shortest path between nodes and thus facilitates global efficiency. Image thresholded using Bonferroni corrected p<0.05 for clarity. (D) Both within-module and between-module connections that strengthen with age have higher edge betweenness centrality than expected by chance. The average weight of (E) within-module and (F) between-module edges that strengthen with age are positively associated with global efficiency. Blue line represents the best fit from a general additive model, shaded area indicates 95% confidence interval; * indicates p<0.001. Error bar represents standard error of the mean. See also Figure S1.
Figure 7
Figure 7. Segregation of structural modules mediates the development of executive function in youth
(A) While controlling for age, greater modular segregation in the frontoparietal control network is uniquely associated with better executive performance (n=880). (B) Segregation of structural modules mediates the improvement of executive function with age. Mediation results shown as standardized regression coefficients. Significance of indirect effect (c’=0.03) was assessed using bootstrapped confidence intervals [0.008–0.045]. The asterisk (*) indicates p<0.01. See also Figure S1.

References

    1. Newman MEJ. Modularity and community structure in networks. Proc Natl Acad Sci USA. 2006;103:8577–82. - PMC - PubMed
    1. Sporns O, Betzel RF. Modular Brain Networks. Annu Rev Psychol. 2016;67:613–640. - PMC - PubMed
    1. Biswal B, Yetkin FZ, Haughton VM, Hyde JS. Functional connectivity in the motor cortex of resting human brain using echo-planar MRI. Magn Reson Med. 1995;34:537–41. - PubMed
    1. Damoiseaux JS, Rombouts S, Barkhof F, Scheltens P, Stam CJ, Smith SM, Beckmann CF. Consistent resting-state networks across healthy subjects. Proc Natl Acad Sci USA. 2006;103:13848–13853. - PMC - PubMed
    1. Power JD, Cohen AL, Nelson SM, Wig GS, Barnes KA, Church JA, Vogel AC, Laumann TO, Miezin FM, Schlaggar BL, et al. Functional network organization of the human brain. Neuron. 2011;72:665–78. - PMC - PubMed

LinkOut - more resources