. 2017 Jun 6;25(6):1374-1389.e6.
doi: 10.1016/j.cmet.2017.04.021. Epub 2017 May 25.

Age-Associated Loss of OPA1 in Muscle Impacts Muscle Mass, Metabolic Homeostasis, Systemic Inflammation, and Epithelial Senescence

Affiliations

Age-Associated Loss of OPA1 in Muscle Impacts Muscle Mass, Metabolic Homeostasis, Systemic Inflammation, and Epithelial Senescence

Caterina Tezze et al. Cell Metab. .

Abstract

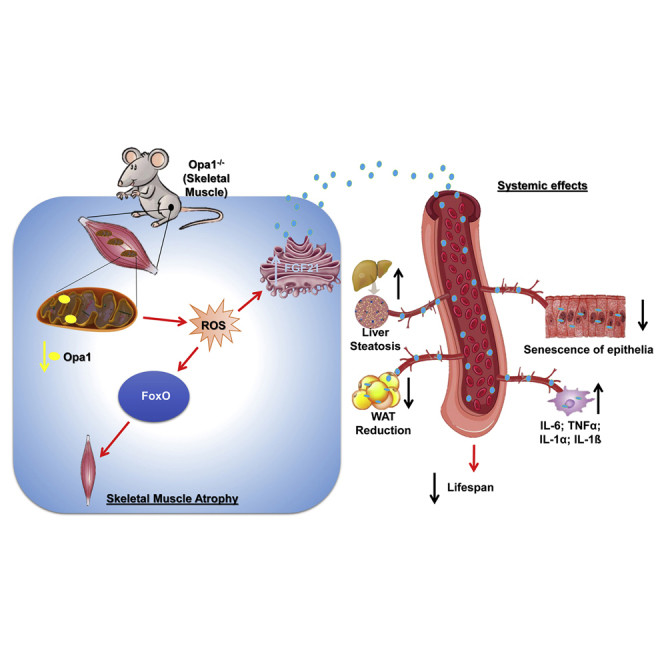
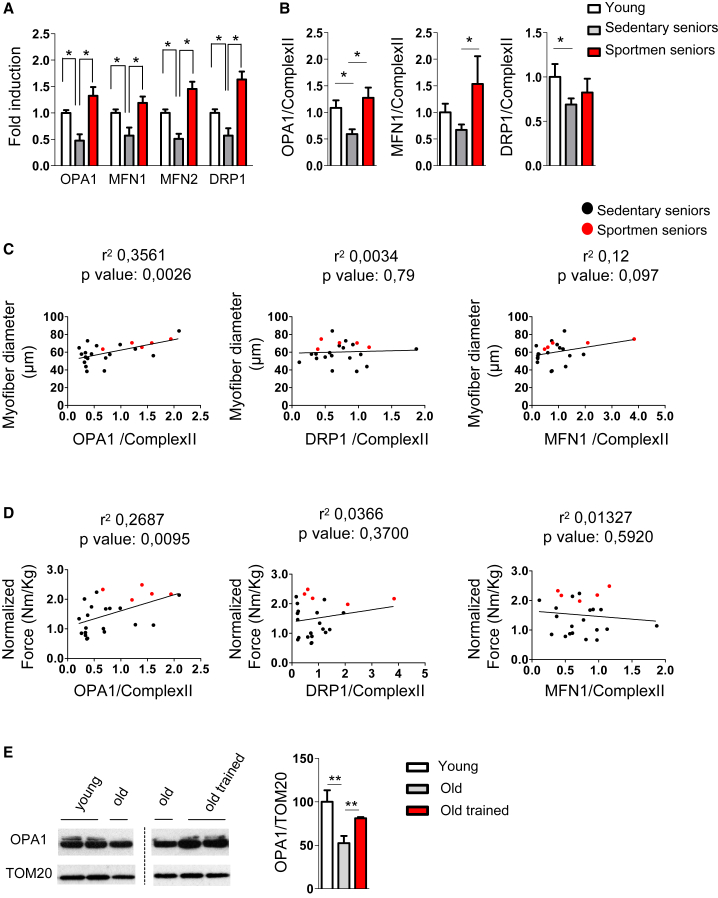
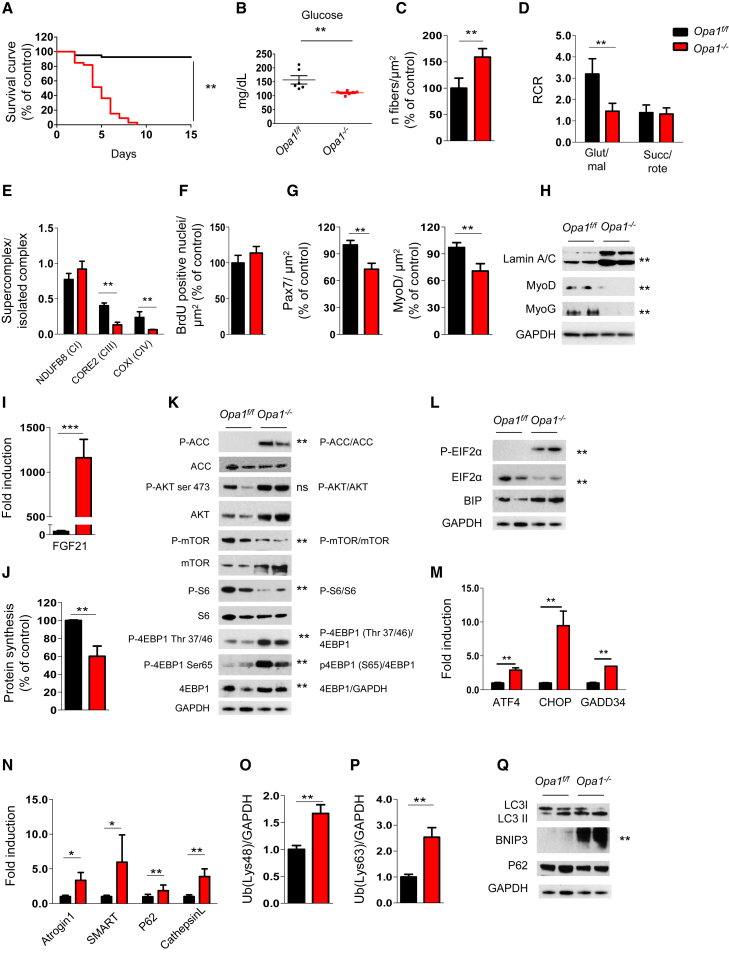
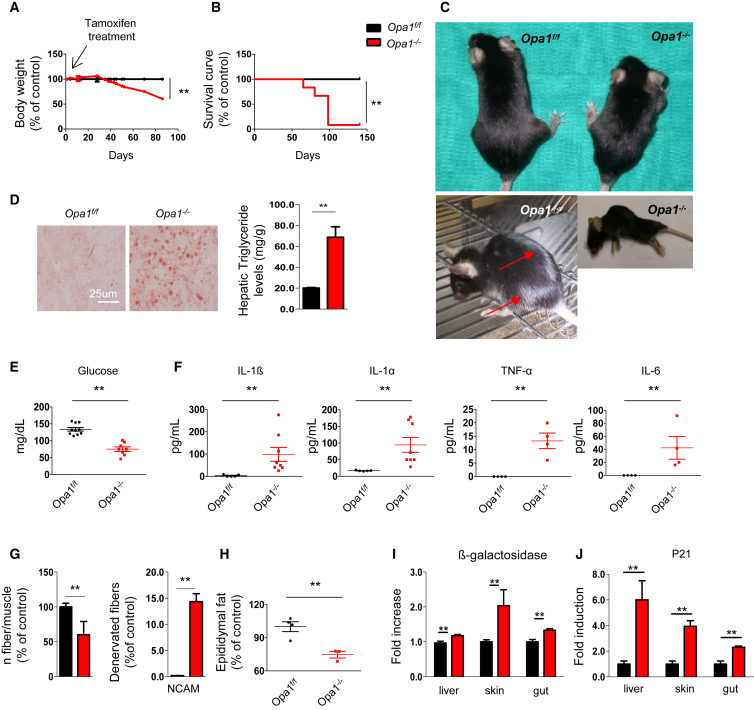
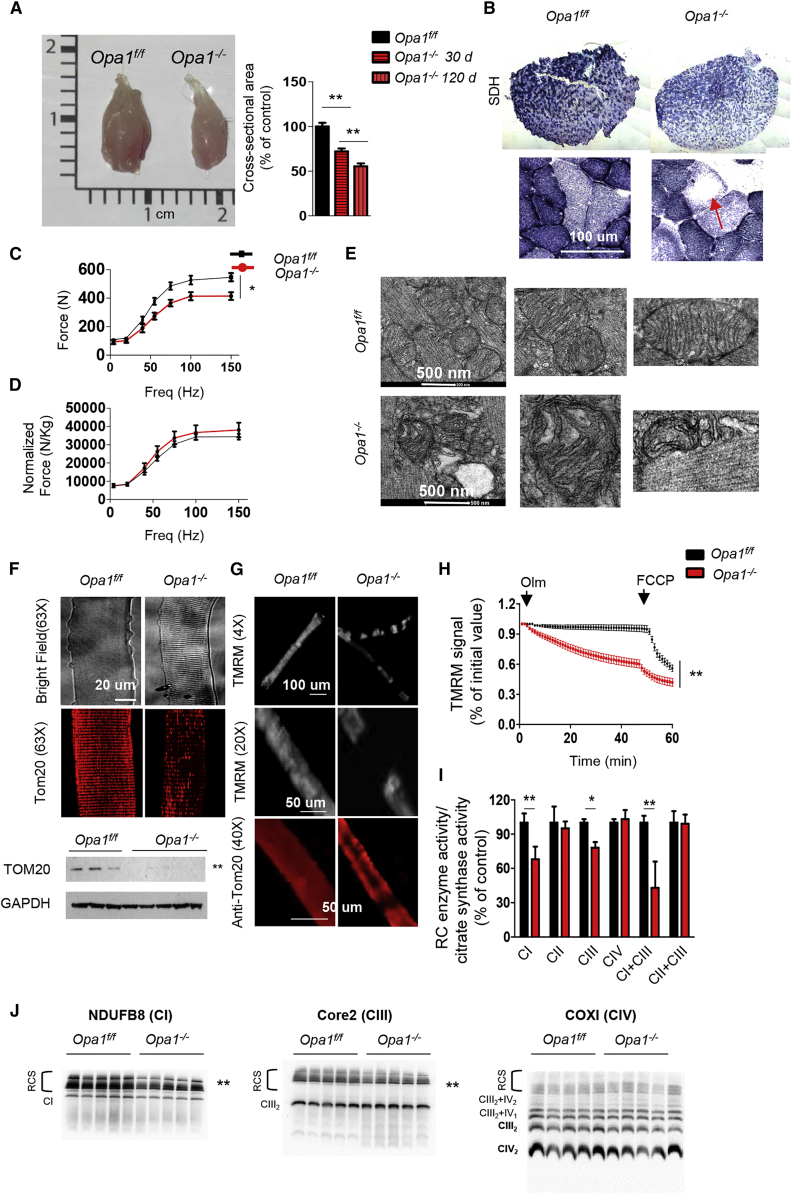
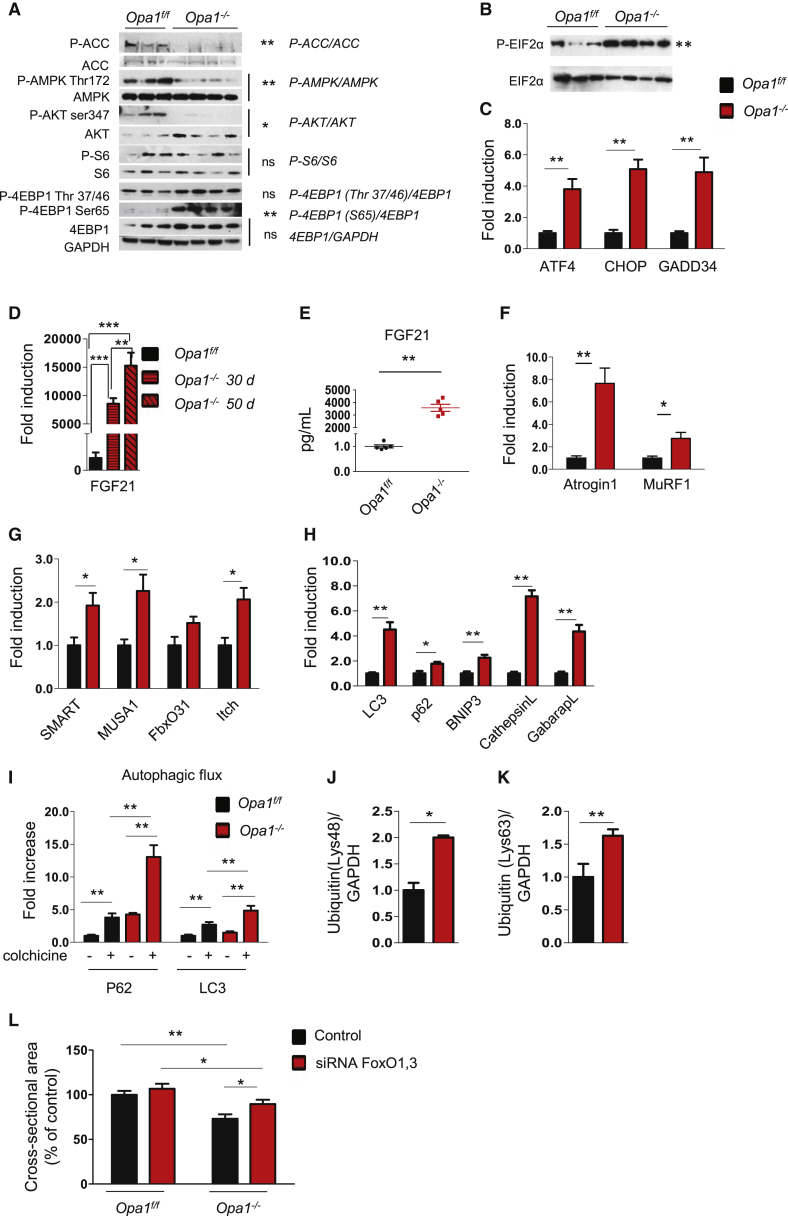
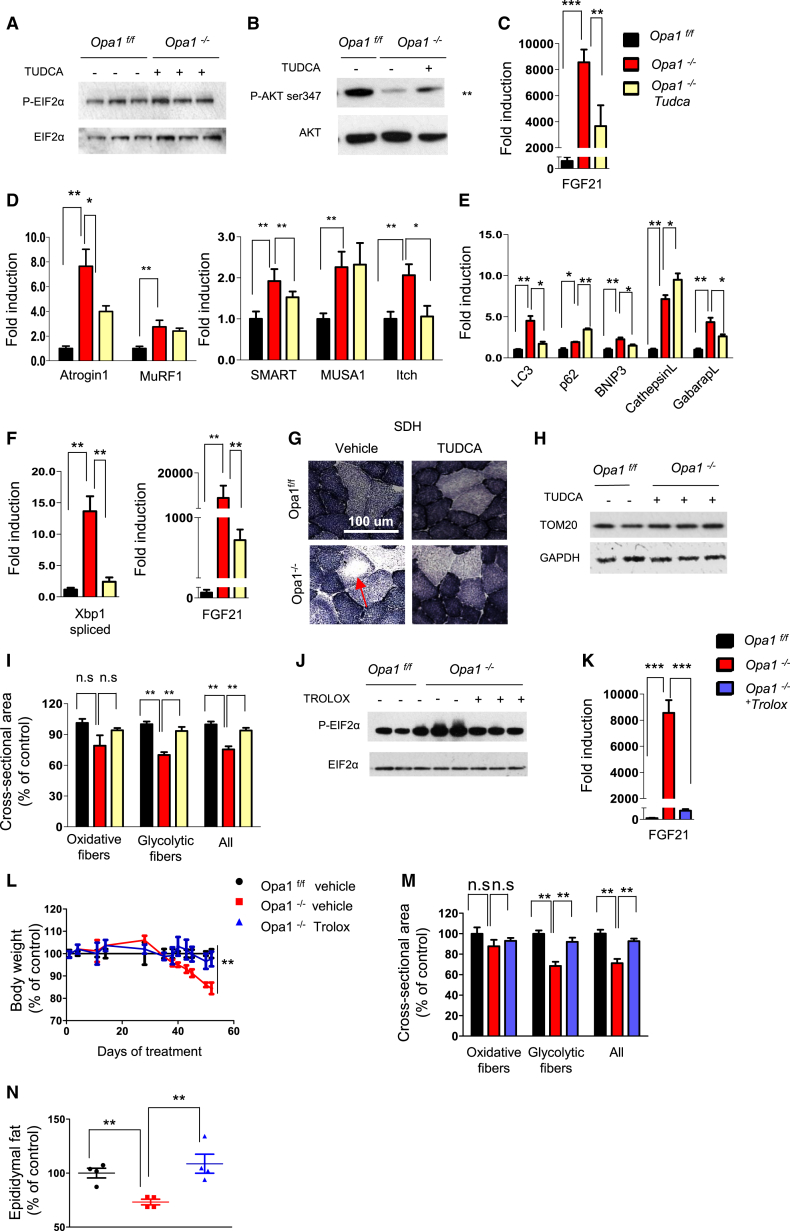
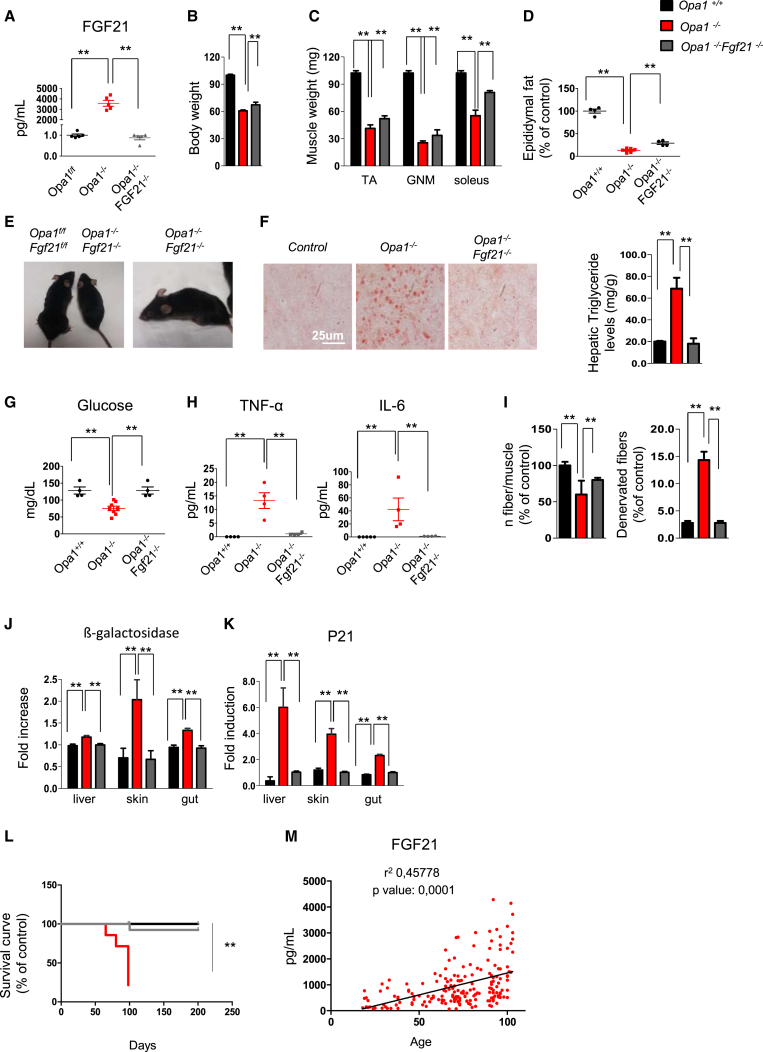
Mitochondrial dysfunction occurs during aging, but its impact on tissue senescence is unknown. Here, we find that sedentary but not active humans display an age-related decline in the mitochondrial protein, optic atrophy 1 (OPA1), that is associated with muscle loss. In adult mice, acute, muscle-specific deletion of Opa1 induces a precocious senescence phenotype and premature death. Conditional and inducible Opa1 deletion alters mitochondrial morphology and function but not DNA content. Mechanistically, the ablation of Opa1 leads to ER stress, which signals via the unfolded protein response (UPR) and FoxOs, inducing a catabolic program of muscle loss and systemic aging. Pharmacological inhibition of ER stress or muscle-specific deletion of FGF21 compensates for the loss of Opa1, restoring a normal metabolic state and preventing muscle atrophy and premature death. Thus, mitochondrial dysfunction in the muscle can trigger a cascade of signaling initiated at the ER that systemically affects general metabolism and aging.

Keywords: FGF21; FoxO; Opa1; aging; inflammation; mitochondria; muscle; oxidative stress; sarcopenia.


Figures

None
Graphical abstract
Figure 1
Figure 1
OPA1 Expression Is Reduced during Aging in Sarcopenic Patients (A) Mitochondria-shaping machinery is downregulated in sarcopenia and maintained by lifelong exercise. Quantitative PCR analysis of mitochondrial dynamics transcripts from human muscle biopsies of 5 young subjects, 7 sedentary seniors, and 11 senior sportsmen is shown. Data represent mean ± SEM and are normalized for GAPDH. (B) Densitometric analysis of OPA1/Complex II, MFN1/Complex II, and DRP1/Complex II signal ratios revealed by immunoblotting. Data represent mean ± SEM of four independent experiments (young = 5, sedentary seniors = 19, senior sportsmen = 5). (C) Linear regression analysis including OPA1, DRP1, and MFN1 expression levels and myofiber size in elderly persons (n = 24). Red spots depict senior sportsmen. (D) Linear regression showing that decrease of OPA1 but not of DRP1 or MFN1 levels correlates with muscle weakness in elderly persons (n = 24). Red spots depict senior sportsmen. (E) Representative immunoblot and densitometric analysis of OPA1 in homogenates of tibialis anterior muscles from young (6 months old, n = 6), old (18 months old, n = 9) and old trained mice (18 months old, n = 6). Data are expressed as mean ± SEM; p ≤ 0.05, ∗∗p < 0.01.
Figure 2
Figure 2
OPA1 Deletion Induces a Lethal Phenotype Characterized by Mitochondrial Dysfunction, Reduction of Myogenic Stem Cells, Decreased Protein Synthesis, and Activation of Protein Breakdown (A) Kaplan-Meier survival curve of Opa1f/f and Opa1−/− littermates (n = 37 for each group) indicates that muscle-specific OPA1 deletion results in lethality by post-natal day 9. ∗∗p < 0.01. (B) Blood glucose levels in control and knockout mice (Opa1f/f n = 6; Opa1−/− n = 7). Data represent mean ± SEM, ∗∗p < 0.01. (C) Analysis of the number of fibers normalized per muscle area (μm2). Data represent mean ± SEM for n = 6, ∗∗p < 0.01. (D) Respiratory control ratio (RCR) of mitochondria energized with 5 mM/2.5 mM glutamate/malate (GLU/MAL) or 10 mM succinate (SUCC/ROTE). Data represent average ± SEM of three independent experiments (n = 9 per each condition), ∗∗p < 0.01. (E) Densitometric quantification of Blue Native-PAGE of respiratory chain supercomplexes (RCS) that were normalized for individual respiratory chain complexes. Data represent mean ± SEM, n = 3, ∗∗p < 0.01. (F) BrdU incorporation in Opa1f/f and Opa1−/− muscles. Data represent mean ± SEM, n = 4. (G) Pax7-positive muscle stem cells and MyoD-positive myoblast were revealed by immunohistochemistry and normalized for muscle area. Data are mean ± SEM for n = 4, ∗∗p < 0.01. (H) Representative immunoblot of muscle homogenates of three independent experiments. Lamin A/C, MyoD, and myogenin (MyoG) were normalized for GAPDH expression. Statistical significance after densitometric analysis is indicated on the right, ∗∗p < 0.01. (I) Quantitative RT-PCR of FGF21 expression in Opa1−/− muscles. Data represent mean ± SEM, ∗∗∗p < 0.001, n = 4. (J) Quantification of puromycin incorporation in skeletal muscles. In vivo SUnSET technique demonstrates a significant reduction of protein synthesis in Opa1−/− muscles. Data are mean ± SEM of three independent experiments (Opa1f/f n = 5; Opa−/− n = 7), ∗∗p < 0.01. (K) Immunoblots of protein extracts from newborn muscles for the indicated antibodies. Representative immunoblots of three independent experiments are shown. Statistical analysis of the densitometric ratio is indicated on the right, n = 7 per each, ns: not significant, ∗∗p < 0.01. (L and M) Representative immunoblots (L) and quantitative RT-PCR (M) showing activation of the UPR pathway in Opa1−/−. Data are mean ± SEM of three independent experiments, ∗∗p < 0.01. (N) Quantitative RT-PCR analysis of FoxO-target genes. Data are mean ± SEM for n = 6, ∗∗p < 0.01. (O and P) Densitometric quantification of lysine 48 (Lys48; O) and lysine 63 (Lys63; P) poly-ubiquitinated proteins from controls and Opa1−/− muscles. Data are mean ± SEM, n = 4, ∗∗p < 0.01. (Q) Representative immunoblot of three independent experiments of autophagy-related proteins. Data are mean ± SEM, ∗∗p < 0.01.
Figure 3
Figure 3
Acute Deletion of OPA1 in Adult Muscles Leads to Metabolic Changes, Precocious Senescence, and Degeneration of Multiple Organs (A) Growth curve of Opa1f/f (black) and Opa1−/− (red) mice after tamoxifen treatment. KO mice start to lose body weight after 30 days from the beginning of the treatment. Data are mean ± SEM (Opa1f/f n = 20, Opa1−/− n = 19), ∗∗p < 0.01. (B) Kaplan-Meier survival curve of Opa1f/f and Opa1−/− adult animals (n = 10 for each group) indicates that muscle-specific OPA1 deletion results in lethality within 3 months from the beginning of the tamoxifen treatment. (C) Eight-month-old Opa1−/− mice show a reduction of total body size (upper panel), white hairs (left bottom panel), and kyphosis (right bottom panel). (D) Lipid content shown by oil red O staining of a representative liver cryosection reveals liver steatosis in Opa1−/− adult animals (left panel). Triglyceride content is increased in liver of Opa1−/−. Data are mean ± SEM for n = 5, ∗∗p < 0.01. (E) Glycemia is reduced in fed knockout mice (Opa1f/f n = 10, Opa1−/− n = 8). Data are mean ± SEM, ∗∗p < 0.01. (F) Blood levels of the inflammatory cytokines IL6, IL1α, IL1β, and TNFα (Opa1f/f n = 5, Opa1−/− n = 8). Data are mean ± SEM, ∗∗p < 0.01. (G) Quantification of myofiber number (left graph) and of denervated NCAM-positive fibers. Data represent mean ± SEM, Opa1f/f n = 3, Opa1−/− n = 4, ∗∗p < 0.01. (H) Epididymal fat content analysis indicates the reduction of white adipose tissue in OPA1 null animals. Data represent mean ± SEM for n = 4, ∗∗p < 0.01. (I and J) β-galactosidase (I) and p21 (J) are significantly increased in liver, skin, and gut. Data represent mean ± SEM (n = 10), ∗∗p < 0.01.
Figure 4
Figure 4
Acute Deletion of OPA1 in Adult Animals Causes Muscle Atrophy and Weakness and Alters Mitochondrial Morphology and Function (A) Left panel: representative picture of gastrocnemius muscles from Opa1f/f and Opa1−/− mice. Right panel: myofiber cross-sectional area analysis of controls and Opa1−/− at 30 and at 120 days from the induction, respectively. Values are mean ± SEM from at least five muscles in each group, ∗∗p < 0.01. (B) SDH staining showed a reduction of mitochondrial content in Opa1−/− that is particularly evident in the center of myofibers (arrow). (C and D) Force-frequency curves performed in vivo on gastrocnemius muscles. Absence of OPA1 leads to a significant decrease of absolute force (C) but not of maximal specific force (D) generated during tetanic contraction. Data represent mean ± SEM (n = 6), p < 0.05. (E) Electron micrographs of EDL muscles of controls and Opa1−/−. (F) Upper panel: representative images of adult isolated myofibers at bright field or immunostained for TOM20 showing decreased mitochondrial content in Opa1−/−. Lower panel: western blot for Tom20 confirms the decrease of mitochondrial mass, ∗∗p < 0.01. (G) Myofibers were stained with the potentiometric dye TMRM. (H) Absence of OPA1 induces mitochondrial depolarization. Isolated adult fibers were loaded with TMRM. Oligomycin and the protonophore FCCP were added at the indicated time points. TMRM staining was monitored in at least 40 fibers per condition, data are mean ± SEM, ∗∗p < 0.01. (I) Mitochondrial respiratory chain (RC) enzymatic activities from muscles of Opa1f/f and Opa1−/−. Data were normalized to citrate synthase (CS) activity and were plotted as percentage of controls, data are mean ± SEM for n = 8, p < 0.05; ∗∗p < 0.01. (J) Representative Blue Native-PAGE gels showing respiratory chain supercomplexes (RCS). CI subunit NDUFB8 (left panel), CIII-Core2 protein 2 (middle panel), and CIV subunit COXI (right panel). n = 10; p < 0.05; ∗∗p ≤ 0.01. CI, Complex I; CII, Complex II; CIII, Complex III; CIV, Complex IV; CI+CIII, Complex I plus Complex III; CII+CIII, Complex II plus Complex III.
Figure 5
Figure 5
Acute OPA1 Inhibition Does Not Affect Protein Synthesis but Triggers an Atrophy Program (A) Total protein extracts from adult muscles were immunoblotted with the indicated antibodies. Representative immunoblots of two independent experiments are shown. Statistical significance after densitometry is indicated on the right. Data are mean ± SEM, p < 0.05, ∗∗p < 0.01. (B) p-eIF2α and total eIF2α immunoblots of muscle homogenates of three independent experiments. Statistical significance after densitometry is indicated on the right. Data are mean ± SEM, ∗∗p ≤ 0.01. (C) Quantitative RT-PCR of genes downstream of UPR. Data are mean ± SEM, n = 5, ∗∗p < 0.01. (D) Quantitative RT-PCR of FGF21 in OPA1-deficient muscles. Data are mean ± SEM, n = 4, ∗∗p < 0.01, ∗∗∗p < 0.001. (E) FGF21 plasma levels in Opa1−/− mice were determined by ELISA (n = 6). ∗∗p < 0.01. (F–H) Quantitative RT-PCR of several atrophy-related genes belonging to the ubiquitin proteasome (F and G) and autophagy-lysosome systems (H). Data are mean ± SEM, n = 5, p < 0.05, ∗∗p < 0.01. (I) Autophagy flux is increased in basal condition in OPA1-deficient muscles. Inhibition of autophagosome-lysosome fusion by colchicine treatment induces higher increase of p62 and LC3II band in OPA1 null than control muscles. Data are mean ± SEM, n = 5, ∗∗p ≤ 0.01. (J and K) Densitometric quantification of lysine 48 (Lys48) and of lysine 63 (Lys63) poly-ubiquitinated proteins of muscle extracts from Opa1f/f and Opa1−/−. Data are mean ± SEM, n = 8, p < 0.05, ∗∗p ≤ 0.01. (L) Opa1−/− mice and Opa1f/f were transfected in vivo with scramble or siRNA against FoxO1/3. Inhibition of FoxOs by RNAi prevented muscle atrophy in Opa1−/− muscles. n = 6 per each group. Data are mean ± SEM, p < 0.05, ∗∗p < 0.01.
Figure 6
Figure 6
TUDCA and Trolox Treatments Prevent ER Stress, Reduce FGF21 Induction, and Spare Muscle Mass (A and B) Representative immunoblots of three independent experiments of p-eIF2α (A) and pAkt (B) in KO animals treated with TUDCA compared to untreated OPA1 null mice. Statistical significance after densitometry is indicated on the right. Data are mean ± SEM, n = 6, ∗∗p < 0.01. (C) Quantitative RT-PCR demonstrated a significant reduction of FGF21 expression in TUDCA-treated (5 days) animals. Data are mean ± SEM, n = 5, ∗∗p < 0.01, ∗∗∗p < 0.001. (D and E) Quantitative RT-PCR analysis of atrophy-related genes. Data are mean ± SEM, n = 5, p < 0.05, ∗∗p < 0.01. (F) Quantitative RT-PCR shows the significant reduction of both spliced XBP1 and FGF21 expression when animals were treated with TUDCA for 2 weeks. Data are mean ± SEM, n = 6, ∗∗p < 0.01. (G) Representative SDH staining shows the maintenance of normal mitochondrial content in TUDCA-treated Opa1−/−. (H) Representative immunoblots of TOM20. (I) Quantification of cross-sectional area of Opa1f/f and Opa1−/− myofibers treated or not with TUDCA. Values are mean ± SEM from at least 4 muscles in each group, ∗∗p < 0.01. (J) Representative immunoblots of p-eIF2α after Trolox treatment in OPA1 null mice. n = 3. (K) Quantitative RT-PCR of FGF21 expression in Trolox-treated mice. Data are mean ± SEM, n = 7, ∗∗∗p < 0.001. (L) Growth curve of control and Opa1−/− mice. Trolox prevented the body weight loss of Opa1−/−. Data are mean ± SEM (Opa1f/f n = 20, Opa1−/− n = 19, Opa1−/− + TROLOX n = 10), ∗∗p < 0.01. (M) Quantification of cross-sectional area of controls and OPA1 knockout myofibers treated or not with Trolox. Values are mean ± SEM from at least four muscles in each group, ∗∗p < 0.01, n.s.: not significant. (N) Epididymal white adipose tissue content of controls and Opa1−/− mice treated or not with Trolox (n = 6 in each group). Data are mean ± SEM, ∗∗p < 0.01.
Figure 7
Figure 7
Acute Simultaneous Deletion of OPA1 and FGF21 Reverted Precocious Epithelial Senescence, Systemic Inflammation, and Premature Death (A) FGF21 plasma levels in OPA1/FGF21-KO, determined by ELISA, are significantly decreased compared to OPA1-deficient animals. Data are mean ± SEM, n = 4, ∗∗p < 0.01. (B) Body weight measured 120 days after the beginning of tamoxifen treatment. Data are mean ± SEM, n = 5, ∗∗p < 0.01. (C) Muscle weight of controls, Opa1−/−, and Opa1−/−Fgf21−/−. Data are mean ± SEM, n = 4, ∗∗p < 0.01. TA, tibialis anterior; GNM, gastrocnemius. (D) Epididymal fat is higher in Opa1−/−Fgf21−/− than in Opa1−/− mice. Data are mean ± SEM (controls n = 4, Opa1−/− n = 8, Opa1−/−Fgf21−/− n = 4), ∗∗p < 0.01. (E) Eight-month-old Opa1−/−Fgf21−/− show reduction of animal size (left panel) but do not show white hairs and kyphosis (right panel). (F) Left panel: representative images of oil red O staining in liver cryosections. Right panel: Quantification of liver triglyceride content. Data are mean ± SEM, n = 4, ∗∗p < 0.01. (G) Fasting blood glucose is restored to normal level in Opa1−/−Fgf21−/− mice. Data are mean ± SEM (Opa1f/f n = 4, Opa1−/− n = 8, Opa1−/−Fgf21−/− n = 4), ∗∗p < 0.01. (H) Blood inflammatory cytokines are back to control level in Opa1−/−Fgf21−/− mice. Data are mean ± SEM, n = 4, ∗∗p < 0.01. (I) Quantification of fibers number per muscle (left panel) and denervated NCAM-positive fibers (right panel) in Opa1−/−, Opa1−/−Fgf21−/−, and controls. Data are mean ± SEM, n = 5, ∗∗p < 0.01. (J and K) Quantification of β-galactosidase and p21 levels. Data represent mean ± SEM, n = 4, ∗∗p < 0.01. (L) Survival curve of control, Opa1−/−, and Opa1−/−Fgf21−/−mice. Data are mean ± SEM (controls n = 19, Opa1−/− n = 20, Opa1−/−Fgf21−/− n = 15), ∗∗p < 0.01. (M) Regression analysis between age and FGF21 plasma levels of human subjects ranging from 19 to 103 years old. Data represent mean ± SEM, n = 180.

References

    1. Alexander C., Votruba M., Pesch U.E., Thiselton D.L., Mayer S., Moore A., Rodriguez M., Kellner U., Leo-Kottler B., Auburger G. OPA1, encoding a dynamin-related GTPase, is mutated in autosomal dominant optic atrophy linked to chromosome 3q28. Nat. Genet. 2000;26:211–215. - PubMed
    1. Amati-Bonneau P., Valentino M.L., Reynier P., Gallardo M.E., Bornstein B., Boissière A., Campos Y., Rivera H., de la Aleja J.G., Carroccia R. OPA1 mutations induce mitochondrial DNA instability and optic atrophy ‘plus’ phenotypes. Brain. 2008;131:338–351. - PubMed
    1. Baskin K.K., Winders B.R., Olson E.N. Muscle as a “mediator” of systemic metabolism. Cell Metab. 2015;21:237–248. - PMC - PubMed
    1. Blaauw B., Canato M., Agatea L., Toniolo L., Mammucari C., Masiero E., Abraham R., Sandri M., Schiaffino S., Reggiani C. Inducible activation of Akt increases skeletal muscle mass and force without satellite cell activation. FASEB J. 2009;23:3896–3905. - PubMed
    1. Caffin F., Prola A., Piquereau J., Novotova M., David D.J., Garnier A., Fortin D., Alavi M.V., Veksler V., Ventura-Clapier R., Joubert F. Altered skeletal muscle mitochondrial biogenesis but improved endurance capacity in trained OPA1-deficient mice. J. Physiol. 2013;591:6017–6037. - PMC - PubMed

MeSH terms

Substances