. 2017 Jul 11;9(1):279-291.
doi: 10.1016/j.stemcr.2017.04.026. Epub 2017 May 25.

Evidence of In Vitro Preservation of Human Nephrogenesis at the Single-Cell Level

Affiliations

Evidence of In Vitro Preservation of Human Nephrogenesis at the Single-Cell Level

Naomi Pode-Shakked et al. Stem Cell Reports. .

Abstract

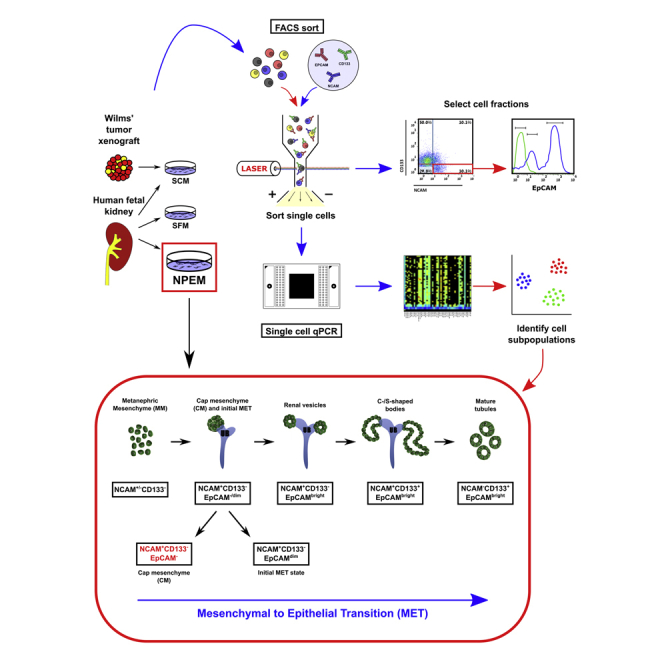
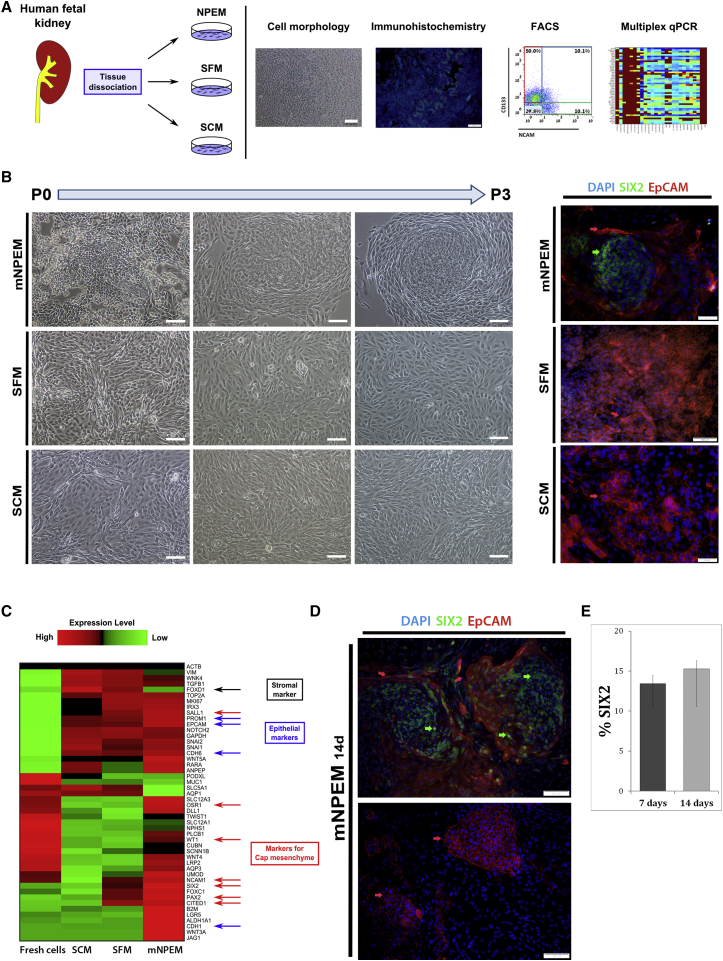
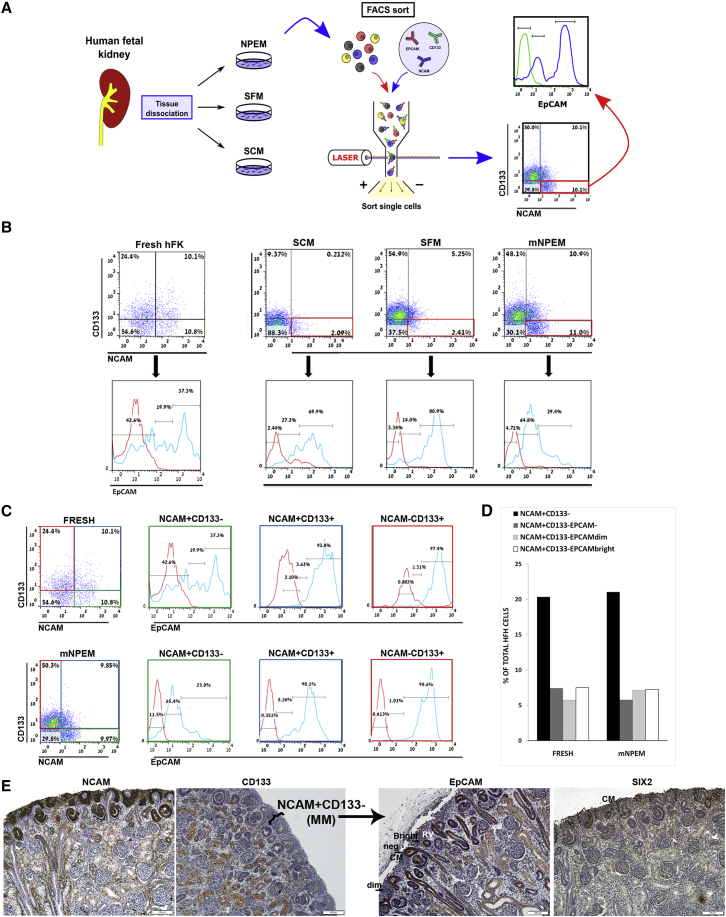
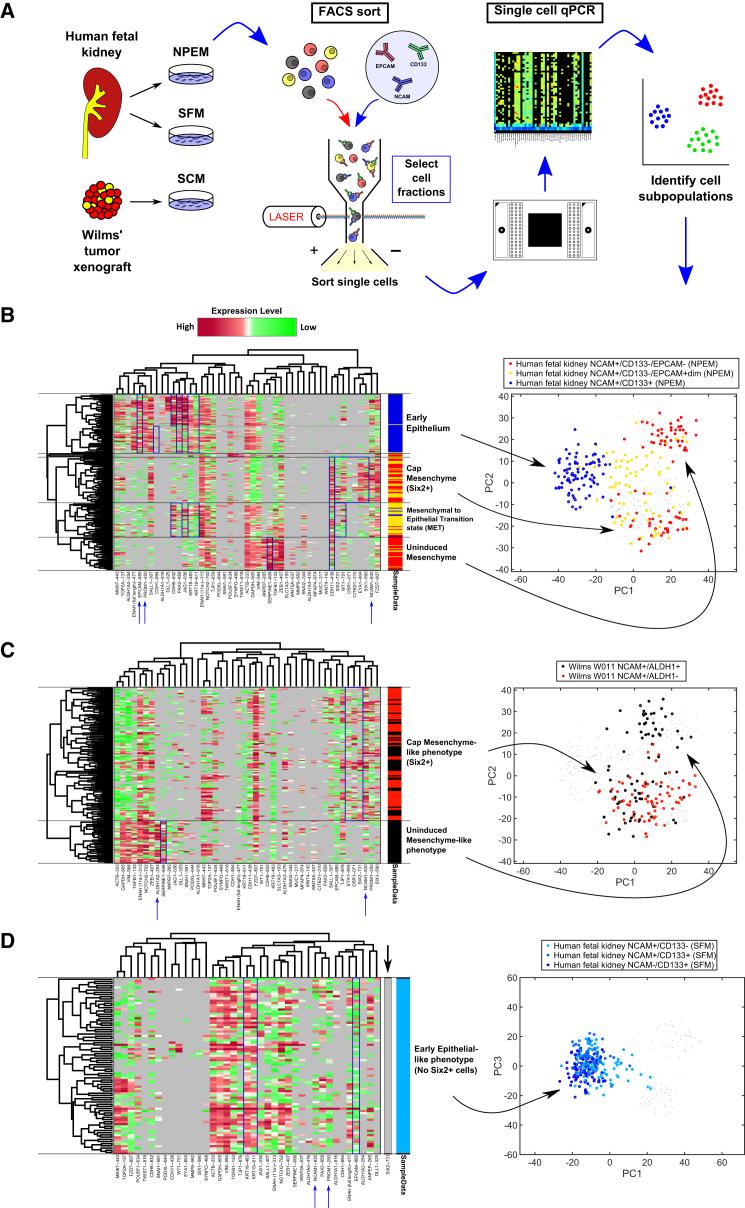
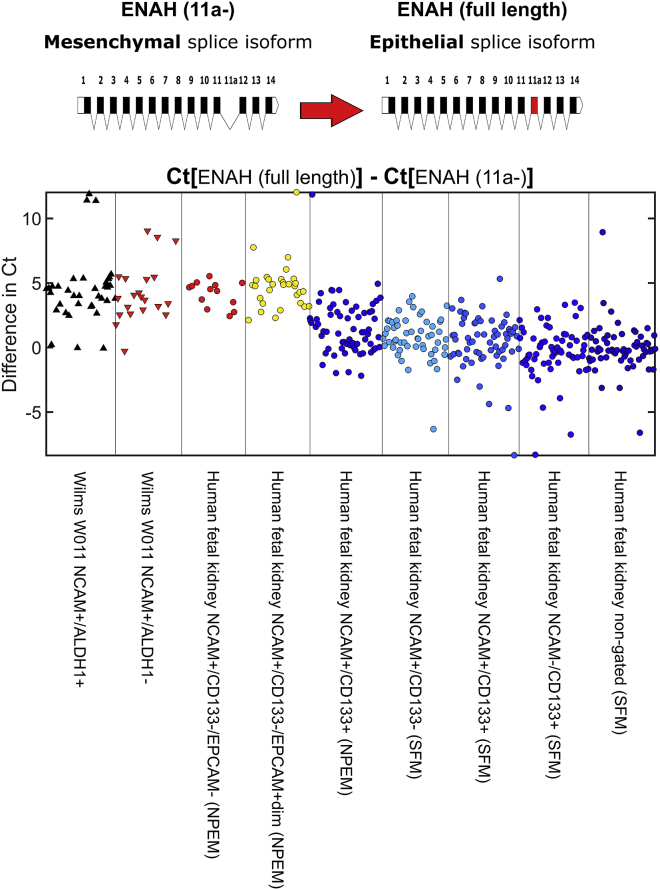
During nephrogenesis, stem/progenitor cells differentiate and give rise to early nephron structures that segment to proximal and distal nephron cell types. Previously, we prospectively isolated progenitors from human fetal kidney (hFK) utilizing a combination of surface markers. However, upon culture nephron progenitors differentiated and could not be robustly maintained in vitro. Here, by culturing hFK in a modified medium used for in vitro growth of mouse nephron progenitors, and by dissection of NCAM+/CD133- progenitor cells according to EpCAM expression (NCAM+/CD133-/EpCAM-, NCAM+/CD133-/EpCAMdim, NCAM+/CD133-/EpCAMbright), we show at single-cell resolution a preservation of uninduced and induced cap mesenchyme as well as a transitioning mesenchymal-epithelial state. Concomitantly, differentiating and differentiated epithelial lineages are also maintained. In vitro expansion of discrete stages of early human nephrogenesis in nephron stem cell cultures may be used for drug screening on a full repertoire of developing kidney cells and for prospective isolation of mesenchymal or epithelial renal lineages for regenerative medicine.

Keywords: Wilms' tumor; cancer stem cells; kidney stem/progenitor cells; renal development; single cell gene expression analysis; stem cell markers; stem cells.


Figures

None
Graphical abstract
Figure 1
Figure 1
In Vitro Growth of hFK Cells in Monolayer Preserves Diversity of Human Embryonic Kidney Cells Only in mNPEM (A) Schematic representation of experiments performed. (B) (Left) Representative morphology of hFK cells cultured in SCM, SFM, or mNPEM over 3 passages. In mNPEM, heterogeneous cell morphology is observed during in vitro culturing on MG-coated plates showing cobblestone, spindle-shaped, and small ovoid-like cells. In addition, cells are organized in unique niches. In contrast, hFK cells grown in SFM show mostly cobblestone morphology that is consistent with epithelial differentiation, and SCM cultures show spindle-shaped morphology that is becoming predominant as the passage number increases. Cells were photographed using a Nikon Digital Sight camera attached to a Nikon Eclipse TS100 microscope. Scale bars, 100 μm. (Right) Immunofluorescence staining for SIX2 and EpCAM in hFK cultures shows that the described heterogeneous “niches” appear only in cells grown in mNPEM (upper image), but not in SFM or SCM. The inner part of the niche contains small cells that are positive for SIX2 while the periphery of the niche is composed mainly of EpCAM+ epithelial cells. In contrast, for both SFM and SCM, no SIX2+ cells could be found and the cells are predominantly EpCAM+ (middle and lower images). Images were obtained using an Olympus DP72 camera attached to an Olympus BX51 fluorescence microscope and processed via cellSens standard software. Scale bars, 50 μm (upper panel) and 100 μm (middle and lower panels). (C) A heatmap representing gene expression levels that were obtained from microfluidic multiplex qPCR of “bulk” RNA from freshly dissociated hFK cells and for hFK cells grown in mNPEM, SFM, or SCM for 7 days. Cells grown in mNPEM preserve diverse hFK lineages, as can be seen from high expression of the markers for CM (SIX2, PAX2, CITED1, SALL1, OSR1, and WT1) and differentiated nephron epithelia (EPCAM, CDH6, and CDH1), as well as low expression of stromal associated genes (FOXD1). In contrast, cells grown in SFM and SCM show significantly lower expression levels for CM markers (at least 5-fold downregulation for SIX2, 15-fold for OSR1, and 25-fold for CITED1). (D) Double labeling of hFK cells grown in mNPEM for 14 days for SIX2 and EpCAM. The upper image represents the “niche” phenotype characterize by inner cells positively stained for SIX2 (green arrows) and peripheral epithelial cells positive for EpCAM (red arrows). The lower image represents a late epithelial stage of human nephrogenesis by cells that predominantly express only EpCAM. Images were obtained using an Olympus DP72 camera attached to an Olympus BX51 fluorescence microscope and processed via cellSens standard software. Scale bars, 100 μm. (E) Bar graph representing the percentage of SIX2+ cells from hFK cells grown in mNPEM compared with fresh hFK (data were averaged over n = 3 independent experiments). See also Figures S1 and S4.
Figure 2
Figure 2
NCAM+CD133 Cells Grown in mNPEM Contain Early Nephrogenic Lineages that Can Be Dissected according to EpCAM Expression Mid-gestation hFKs were dissociated and cultured in serum-containing medium (SCM), serum-free medium (SFM), and mNPEM. FACS analysis was performed for NCAM1, a marker that was previously shown to enrich for the CM and early epithelial structures, CD133 (PROM1), a marker that was previously shown to enrich for differentiating and mature epithelial nephron tubules in the fetal kidney, and EpCAM, an epithelial marker (Pode-Shakked et al., 2016, Shapiro et al., 2011). (A) Schematic representation of experiments. (B) Representative FACS analysis of fresh hFK and hFK cultured in either mNPEM, SFM, or SCM for 7 days. Cells that were grown in mNPEM preserve the NCAM1+CD133 cell fraction, similar to freshly dissociated cells (11% and 10.8%, respectively). In contrast, SCM and SFM show decreased percentages of NCAM1+CD133 cells (2.09% and 2.41%, respectively). Moreover, in both freshly dissociated hFK and cells grown in mNPEM, most cells are EpCAMdim or EpCAM (42.6 + 19.9 = 62.5% and 4.71 + 64.8 = 69.51%, respectively), while cells grown in SCM or SFM show a much smaller percentage of EpCAMdim or EpCAM populations (2.44 + 27.2 = 29.64% and 3.34 + 14 = 17.34%, respectively). (C) Close examination of the different cell subpopulations in fresh hFK and mNPEM cultures shows that in addition to maintaining the NCAM+CD133 subpopulation and EpCAM distribution, the NCAM1+CD133+ and NCAMCD133+ that represent the more epithelial differentiating and differentiated cells are also preserved in these cultures in a way that is comparable with fresh cells (note that the mNPEM cells here are from a different biological replicate than those in B, but the numbers are comparable). The gradual increase in EpCAMbright cells (to ∼98% and 97% in the NCAM/CD133+ cell population) in both mNPEM-grown and fresh hFK cells is consistent with earlier findings and further stresses the preservation of all hFK epithelial lineages in mNPEM. See also Figure S2. (D) Bar graph showing mean percentages of NCAM+CD133 cell subpopulations in fresh hFK and mNPEM cultures and the distribution of EpCAM subpopulations within this fraction (data were averaged over three independent experiments from three different hFK sources, n = 3). (E) Immunohistochemical staining of hFK tissue (from a 22-week embryo) for NCAM, CD133, EpCAM, and SIX2 showing that within the NCAM+CD133 section of the MM, the EpCAMbright cells correspond to early epithelial differentiation (renal vesicles in particular), while the EpCAM and EpCAMdim cells are restricted to the most cortical region containing the SIX2+ cells of the CM and early CM progeny. MM, metanephric mesenchyme; CM, condensed mesenchyme; RV, renal vesicle; T, tubules. Scale bars, 100 μm. See also Figure S2 and Table S2.
Figure 3
Figure 3
Single-Cell Gene Expression Analysis of Prospectively Isolated hFK-Cultured Cells Reveals Cell Subpopulations Representing All Stages of Human Nephrogenesis (A) Schematic representation of the experiments performed. (B) Gene expression heatmap and corresponding PCA plot of ∼240 single cells (rows) and 47 genes (columns) measured simultaneously from each cell. Gene expression levels (in terms of threshold cycles, Ct) were standardized and clustered such that phenotypically similar cells are grouped next to each other (red, high expression; green, low expression; gray, no expression). Cells were isolated from human fetal kidney, cultured in mNPEM for 7 days, and sorted by FACS into three fractions: NCAM+CD133EPCAM, NCAM+CD133EPCAMdim, and NCAM+CD133+. The colors in the column on the right of the heatmap and in the PCA plot represent the FACS-sorted fraction of origin of each individual cell. We identified distinct cell subpopulations whose expression profiles correspond to the CM (SIX2+WT1+OSR1+CITED1+EYA1+SIX1+CDH11+), early nephric epithelia (EPCAM+CDH1+CDH6+PAX2+KRT18+KRT19+), and a MET-transition state (many of which cells express both CM and epithelial markers). An additional mesenchymal subpopulation (SERPINE1+ZEB1highCDH11+SIX2) is hypothesized to correspond to the nephrogenic interstitium (containing the uninduced metanephric mesenchymal/stromal cells of the nephrogenic zone). (C) Similar analysis of ∼160 single cells from the tumorigenic (NCAM+ALDH1+) and non-tumorigenic (NCAM+ALDH1) cell fractions of a late (passage 10) blastemal Wilms' tumor-PDX reveals two cell subpopulations: a CM-like subpopulation (EYA1+OSR1+SIX2+SIX1+), found in both cell fractions, and an uninduced mesenchyme-like subpopulation (SERPINE1+SIX2) found only in the tumorigenic fraction. (D) All three cell fractions (NCAM+CD133, NCAM+CD133+, and NCAMCD133+) sorted from hFK cells cultured in SFM for 10 days have a nephric epithelial phenotype (EPCAM+KRT18+KRT19+SIX2). In the NCAM+CD133 fraction, we did find a small number of more early mesenchymal cells (CDH11+), but no measurable SIX2+ cells were found within the ∼240 cells that we measured. In all heatmaps, genes that had zero expression in all cells are not shown (apart from SIX2). Note that PCA analysis in (B) and (C) was performed on a union of all cell fractions from hFK-mNPEM and Wilms' tumor cells, whereas in (D) only hFK-SFM cell fractions were included, along with the hFK-mNPEM mesenchymal fraction (NCAM+CD133EPCAM) to allow for better visual comparison. See also Figure S3; Tables S1 and S3.
Figure 4
Figure 4
Splice Isoform Expression Analysis at the Single-Cell Level Shows Epithelial and Mesenchymal Phenotypes in Prospectively Isolated hFK-Cultured Cells and WT-PDX Shown is the relative expression (in terms of the difference in qPCR threshold cycles, Ct) between the epithelial and mesenchymal isoforms of the gene ENAH. For clarity, only cells in which both isoforms were detected are shown. It can be seen that hFK cells cultured in mNPEM contain subpopulations with both a predominant mesenchymal isoform (NCAM+CD133EPCAM and NCAM+CD133EPCAMdim) and a predominant epithelial isoform (NCAM+CD133+). Both fractions (NCAM1+ADLH1+ and NCAM1+ADLH1) of the blastemal Wilms' tumor-PDX had strong overexpression of the mesenchymal isoform, and all three fractions (NCAM+CD133, NCAM+CD133+, and NCAMCD133+) of hFK cells cultured in SFM overexpressed the epithelial isoform.

Similar articles

Cited by

References

    1. Boyle S., Misfeldt A., Chandler K.J., Deal K.K., Southard-Smith E.M., Mortlock D.P., Baldwin H.S., de Caestecker M. Fate mapping using Cited1-CreERT2 mice demonstrates that the cap mesenchyme contains self-renewing progenitor cells and gives rise exclusively to nephronic epithelia. Dev. Biol. 2008;313:234–245. - PMC - PubMed
    1. Brown A.C., Muthukrishnan S.D., Oxburgh L. A synthetic niche for nephron progenitor cells. Dev. Cell. 2015;34:229–241. - PMC - PubMed
    1. Cho E.A., Patterson L.T., Brookhiser W.T., Mah S., Kintner C., Dressler G.R. Differential expression and function of cadherin-6 during renal epithelium development. Development. 1998;125:803–812. - PubMed
    1. Daar A.S. The case for a regulated system of living kidney sales. Nat. Clin. Pract. Nephrol. 2006;2:600–601. - PubMed
    1. Dalerba P., Kalisky T., Sahoo D., Rajendran P.S., Rothenberg M.E., Leyrat A.A., Sim S., Okamoto J., Johnston D.M., Qian D. Single-cell dissection of transcriptional heterogeneity in human colon tumors. Nat. Biotechnol. 2011;29:1120–1127. - PMC - PubMed

Publication types

Substances