. 2017 May 26;11(5):e0005599.
doi: 10.1371/journal.pntd.0005599. eCollection 2017 May.

Optimising cluster survey design for planning schistosomiasis preventive chemotherapy

Affiliations

Optimising cluster survey design for planning schistosomiasis preventive chemotherapy

Sarah C L Knowles et al. PLoS Negl Trop Dis. .

Abstract

Background: The cornerstone of current schistosomiasis control programmes is delivery of praziquantel to at-risk populations. Such preventive chemotherapy requires accurate information on the geographic distribution of infection, yet the performance of alternative survey designs for estimating prevalence and converting this into treatment decisions has not been thoroughly evaluated.

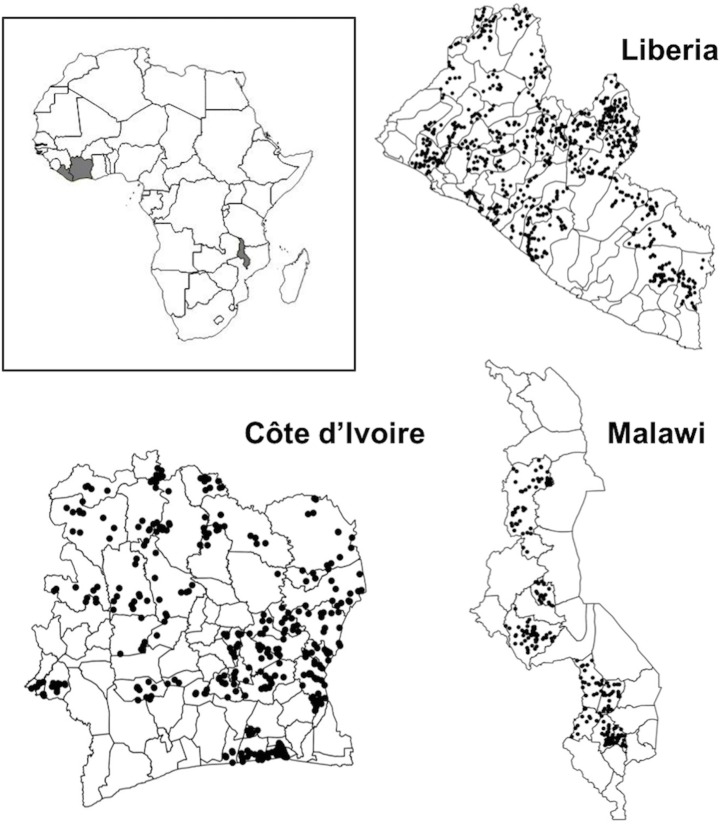
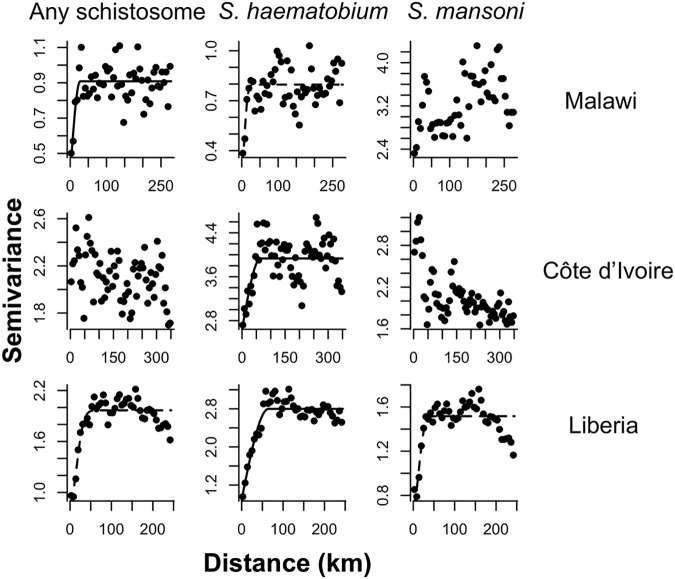
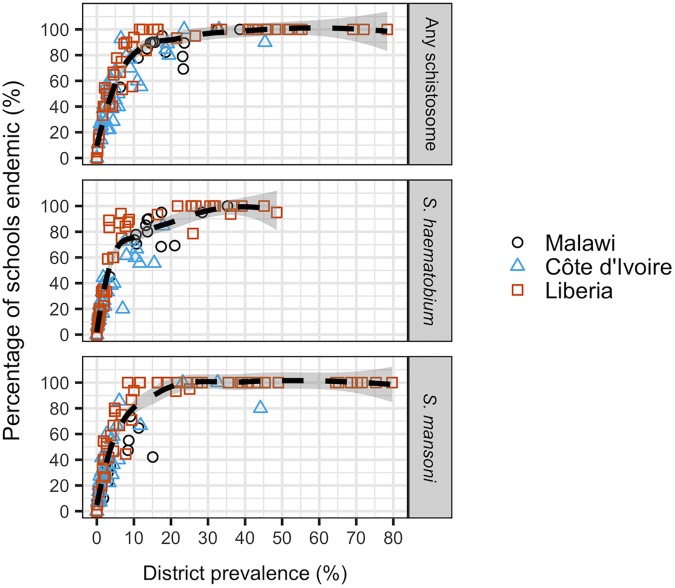
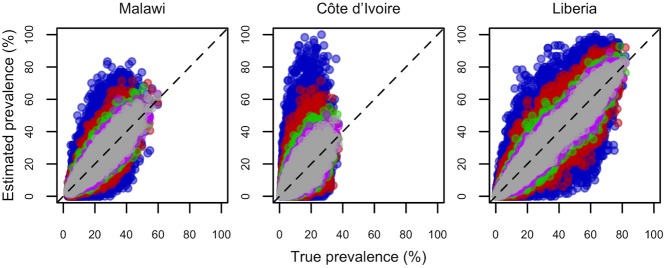
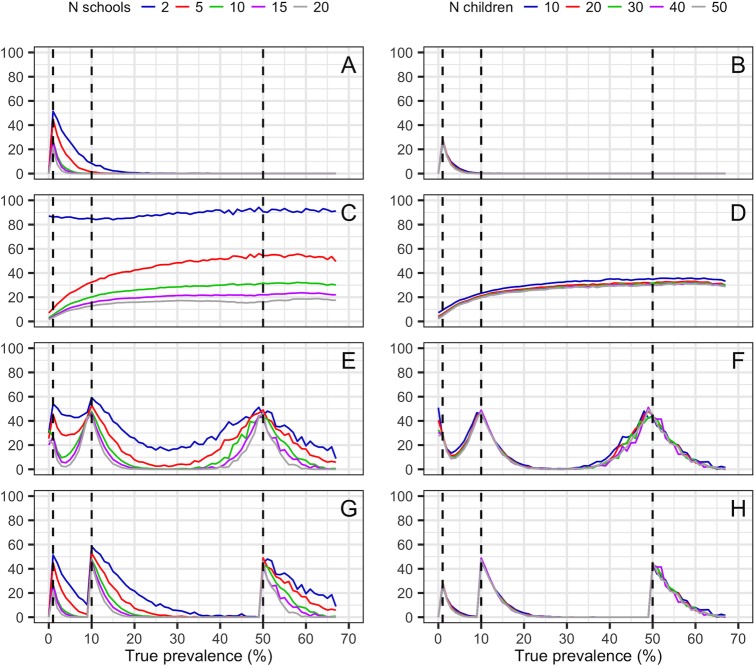
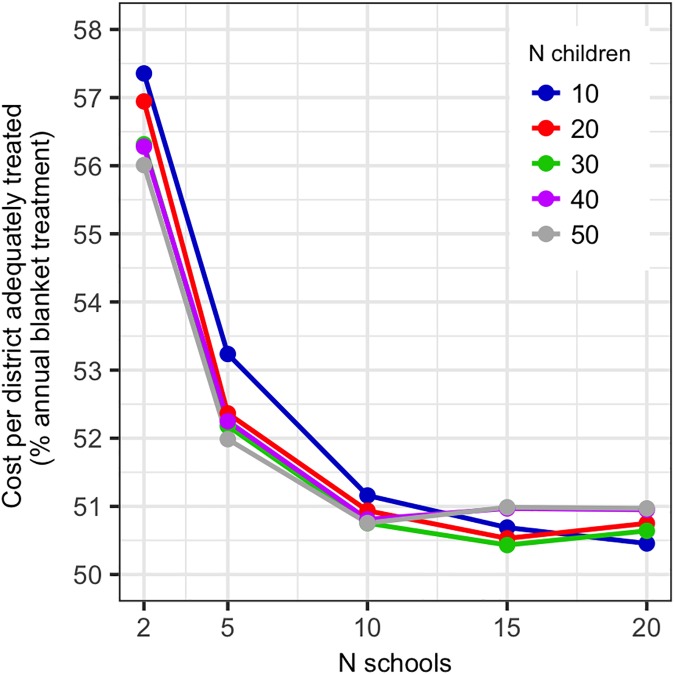
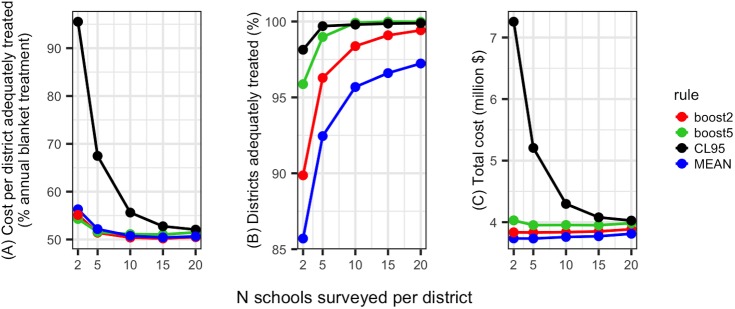
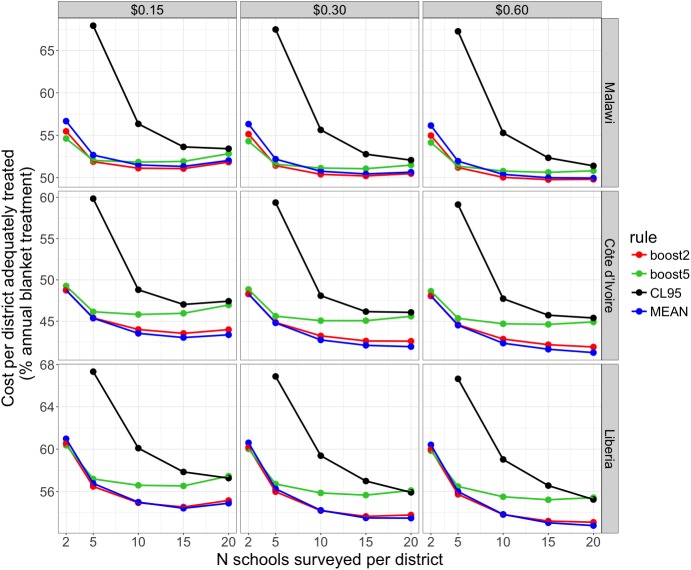
Methodology/principal findings: We used baseline schistosomiasis mapping surveys from three countries (Malawi, Côte d'Ivoire and Liberia) to generate spatially realistic gold standard datasets, against which we tested alternative two-stage cluster survey designs. We assessed how sampling different numbers of schools per district (2-20) and children per school (10-50) influences the accuracy of prevalence estimates and treatment class assignment, and we compared survey cost-efficiency using data from Malawi. Due to the focal nature of schistosomiasis, up to 53% simulated surveys involving 2-5 schools per district failed to detect schistosomiasis in low endemicity areas (1-10% prevalence). Increasing the number of schools surveyed per district improved treatment class assignment far more than increasing the number of children sampled per school. For Malawi, surveys of 15 schools per district and 20-30 children per school reliably detected endemic schistosomiasis and maximised cost-efficiency. In sensitivity analyses where treatment costs and the country considered were varied, optimal survey size was remarkably consistent, with cost-efficiency maximised at 15-20 schools per district.

Conclusions/significance: Among two-stage cluster surveys for schistosomiasis, our simulations indicated that surveying 15-20 schools per district and 20-30 children per school optimised cost-efficiency and minimised the risk of under-treatment, with surveys involving more schools of greater cost-efficiency as treatment costs rose.


Conflict of interest statement

The authors have declared that no competing interests exist.

Figures

Fig 1
Fig 1. Spatial distribution of geo-referenced primary schools involved in schistosomiasis baseline mapping surveys in Malawi (n = 244), Côte d’Ivoire (n = 500) and Liberia (n = 933).
Data from these sites were used to estimate semivariograms and generate spatially realistic gold standard datasets on which sampling simulations were performed.
Fig 2
Fig 2. Omnidirectional semivariograms for schistosomiasis prevalence across primary schools in Malawi, Côte d’Ivoire and Liberia.
Best fit lines of exponential (solid line) or Gaussian (dashed line) spatial models are shown and where no line is shown no significant spatial autocorrelation was detected. Distance in kilometres was calculated assuming 1 decimal degree is approximately 111km (as at the equator).
Fig 3
Fig 3. District-level relationship between prevalence and the percentage of schools endemic for schistosomiasis (any species), S. haematobium or S. mansoni in Côte d’Ivoire, Malawi and Liberia.
Data were collected from mapping surveys using a standardised two-stage cluster survey design: random sampling of 15–20 schools per district, and 30 children at each school.
Fig 4
Fig 4. Plots illustrating the relationship between estimated and true schistosomiasis prevalence across 1000 simulated realisations for Malawi, Côte d’Ivoire and Liberia.
All data relate to a sample size of 30 children per school, and colours represent the number of schools sampled per district (blue = 2, red = 5, green = 10, pink = 15, grey = 20). Each dot represents a realisation, and dashed lines indicate perfect correspondence between true and estimated prevalence. Points from surveys of different sizes are overlaid, from smallest (n = 2 schools, blue points at the back) to largest (n = 20 schools, grey points at the front).
Fig 5
Fig 5. The effect of survey design on district-level schistosomiasis treatment decisions, using gold standard simulated data for Malawi, Côte d’Ivoire and Liberia.
Left panels (A, C, E, G) show the effect of altering the number of schools sampled, while holding the number of children sampled constant at 30 per school, while right panels (B, D, F, H) show the effect of altering the number of children tested at each school, while holding the number of schools visited constant at 10 per district. Dashed lines indicate thresholds between low, moderate and high endemicity treatment classes according to WHO guidelines (Table 1). Lines indicate mean values for each survey design across the full three country gold standard dataset. A and B: the proportion of times a survey failed to detect endemic schistosomiasis (≥1% prevalence); C and D: the width of the 95% confidence interval around a district-level prevalence estimate; E and F: the proportion of times districts were wrongly classified into either a higher or lower treatment class; G and H: the proportion of times districts were classified into a treatment class below their true class.
Fig 6
Fig 6. Effect of altering the number of schools surveyed per district and the number of children sampled per school in schistosomiasis surveys on the cost per district adequately treated (cost-efficiency is maximised when this is at a minimum).
Fig 7
Fig 7
The effect of schistosomiasis survey size (number of schools surveyed per district) and the rule used for converting district-prevalence estimates into treatment class assignments on (A) the cost per district adequately treated (cost-efficiency is maximised when this is at a minimum), (B) the proportion of times a district was adequately treated and (C) combined survey and subsequent treatment costs. Line colour indicates the district classification rule used (blue: point prevalence estimate; red: 2% boost at thresholds, green: 5% boost at thresholds, black: upper 95% confidence limit). All plots relate to surveys where 30 children were sampled per school.
Fig 8
Fig 8. Effect of variation in per capita PZQ treatment costs (0.15 to 0.60 USD) and the country source of simulation results on estimates of mapping survey cost-efficiency.
Cost-efficiency is expressed as the cost per district adequately treated, as a percentage of the annual blanket treatment cost for a district. Line colour indicates the district classification rule used (blue: point prevalence estimate; red: 2% boost at thresholds, green: 5% boost at thresholds, black: upper 95% confidence limit). All plots relate to surveys where 30 children were sampled per school. Data points for surveys using 2 schools per district and assignment using the upper 95% confidence limit (which all produced very high values, >90% on the y-axis) are not shown, to improve clarity in the lower range of the y-axis.

References

    1. Van Der Werf MJ, De Vlas SJ, Brooker S, Looman CWN, Nagelkerke NJD, Habbema JDF, et al. Quantification of clinical morbidity associated with schistosome infection in sub-Saharan Africa. Acta Trop. 2003;86: 125–139. - PubMed
    1. Lozano R, Naghavi M, Foreman K, Lim S, Shibuya K, Aboyans V, et al. Global and regional mortality from 235 causes of death for 20 age groups in 1990 and 2010: A systematic analysis for the Global Burden of Disease Study 2010. Lancet. 2012;380: 2095–2128. doi: 10.1016/S0140-6736(12)61728-0 - DOI - PMC - PubMed
    1. Murray CJL, Vos T, Lozano R, Naghavi M, Flaxman AD, Michaud C, et al. Disability-adjusted life years (DALYs) for 291 diseases and injuries in 21 regions, 1990–2010: A systematic analysis for the Global Burden of Disease Study 2010. Lancet. 2012;380: 2197–2223. doi: 10.1016/S0140-6736(12)61689-4 - DOI - PubMed
    1. Fenwick A, Webster JP, Bosque-Oliva E, Blair L, Fleming FM, Zhang Y, et al. The Schistosomiasis Control Initiative (SCI): rationale, development and implementation from 2002–2008. Parasitology. 2009;136: 1719–30. doi: 10.1017/S0031182009990400 - DOI - PubMed
    1. Webster JP, Molyneux DH, Hotez PJ, Fenwick A. The contribution of mass drug administration to global health: past, present and future. Philos Trans R Soc L B Biol Sci. 2014;369: 20130434. - PMC - PubMed