

Automated analysis of co-localized protein expression in histologic sections of prostate cancer
- PMID: 28552967
- PMCID: PMC5446169
- DOI: 10.1371/journal.pone.0178362
Automated analysis of co-localized protein expression in histologic sections of prostate cancer
Abstract
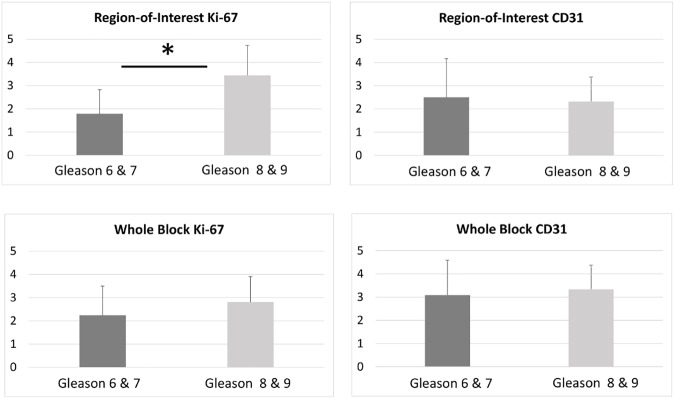
An automated approach based on routinely-processed, whole-slide immunohistochemistry (IHC) was implemented to study co-localized protein expression in tissue samples. Expression of two markers was chosen to represent stromal (CD31) and epithelial (Ki-67) compartments in prostate cancer. IHC was performed on whole-slide sections representing low-, intermediate-, and high-grade disease from 15 patients. The automated workflow was developed using a training set of regions-of-interest in sequential tissue sections. Protein expression was studied on digital representations of IHC images across entire slides representing formalin-fixed paraffin embedded blocks. Using the training-set, the known association between Ki-67 and Gleason grade was confirmed. CD31 expression was more heterogeneous across samples and remained invariant with grade in this cohort. Interestingly, the Ki-67/CD31 ratio was significantly increased in high (Gleason ≥ 8) versus low/intermediate (Gleason ≤7) samples when assessed in the training-set and the whole-tissue block images. Further, the feasibility of the automated approach to process Tissue Microarray (TMA) samples in high throughput was evaluated. This work establishes an initial framework for automated analysis of co-localized protein expression and distribution in high-resolution digital microscopy images based on standard IHC techniques. Applied to a larger sample population, the approach may help to elucidate the biologic basis for the Gleason grade, which is the strongest, single factor distinguishing clinically aggressive from indolent prostate cancer.
Conflict of interest statement
Figures


References
-
- American Cancer Society: Key statistics for prostate cancer [Aug. 5, 2016]. Available from: www.cancer.org.
-
- Epstein JI, Egevad L, Amin MB, Delahunt B, Srigley JR, Humphrey PA, et al. The 2014 International Society of Urological Pathology (ISUP) Consensus Conference on Gleason Grading of Prostatic Carcinoma: Definition of Grading Patterns and Proposal for a New Grading System. Am J Surg Pathol. 2016;40(2):244–52. doi: 10.1097/PAS.0000000000000530 - DOI - PubMed
-
- Cooperberg MR, Pasta DJ, Elkin EP, Litwin MS, Latini DM, Du Chane J, et al. The University of California, San Francisco Cancer of the Prostate Risk Assessment score: a straightforward and reliable preoperative predictor of disease recurrence after radical prostatectomy. J Urol. 2005;173(6):1938–42. PubMed Central PMCID: PMCPMC2948569. doi: 10.1097/01.ju.0000158155.33890.e7 - DOI - PMC - PubMed
-
- Cooperberg MR, Freedland SJ, Pasta DJ, Elkin EP, Presti JC Jr., Amling CL, et al. Multiinstitutional validation of the UCSF cancer of the prostate risk assessment for prediction of recurrence after radical prostatectomy. Cancer. 2006;107(10):2384–91. doi: 10.1002/cncr.22262 - DOI - PubMed
-
- Cooperberg MR, Hilton JF, Carroll PR. The CAPRA-S score: A straightforward tool for improved prediction of outcomes after radical prostatectomy. Cancer. 2011;117(22):5039–46. PubMed Central PMCID: PMCPMC3170662. doi: 10.1002/cncr.26169 - DOI - PMC - PubMed
MeSH terms
Substances
Grants and funding
LinkOut - more resources
Full Text Sources
Other Literature Sources
Medical
