

Cellular and cell-free studies of catalytic DNA cleavage by ruthenium polypyridyl complexes containing redox-active intercalating ligands
- PMID: 28553531
- PMCID: PMC5428021
- DOI: 10.1039/c6sc04094b
Cellular and cell-free studies of catalytic DNA cleavage by ruthenium polypyridyl complexes containing redox-active intercalating ligands
Abstract
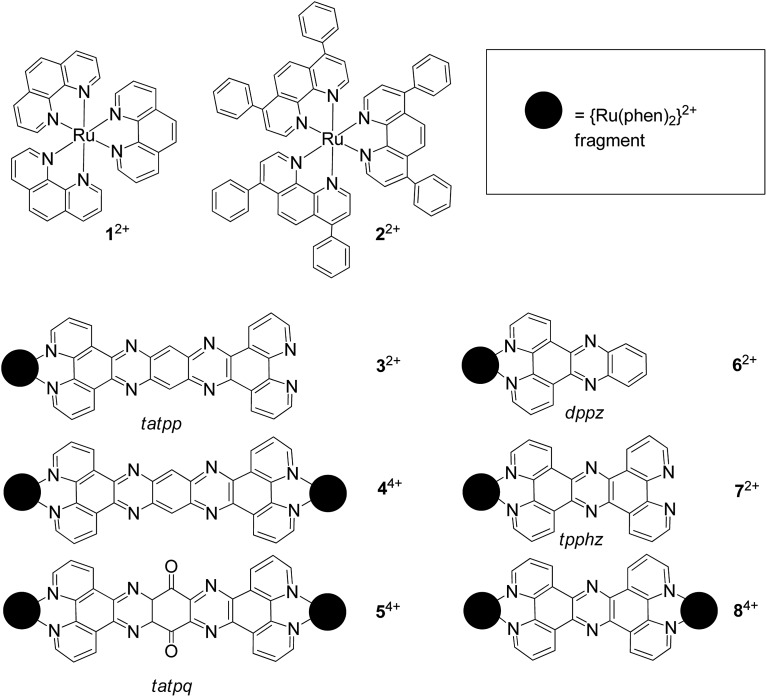
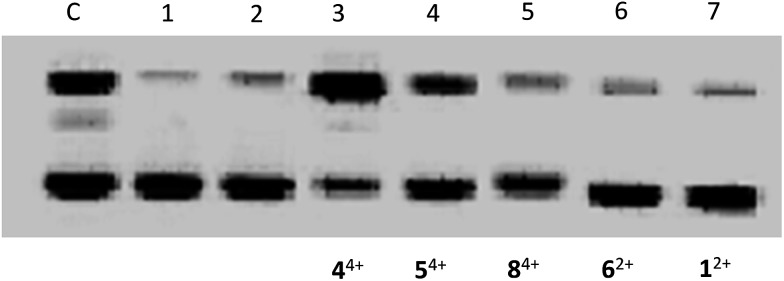
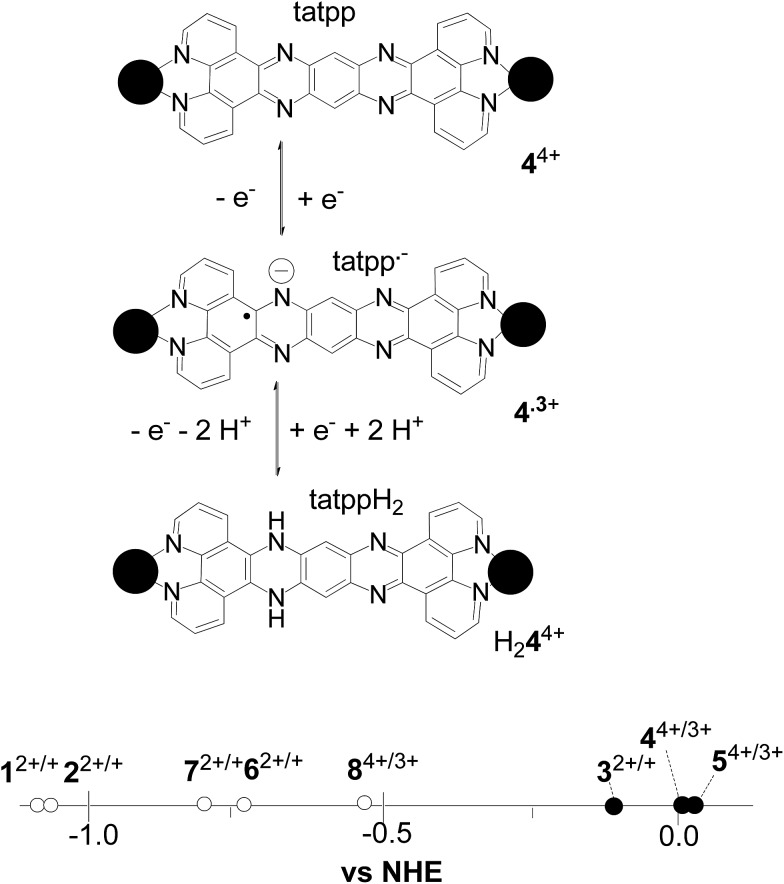
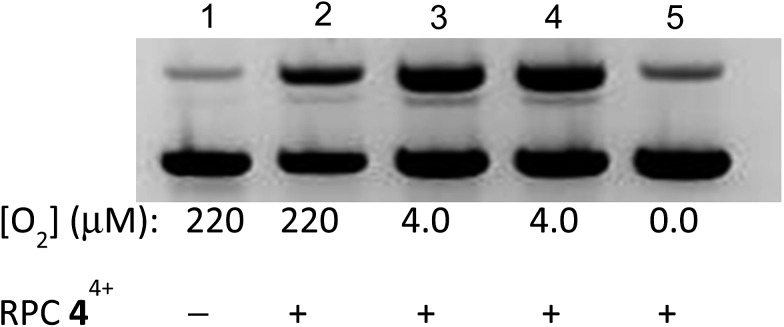
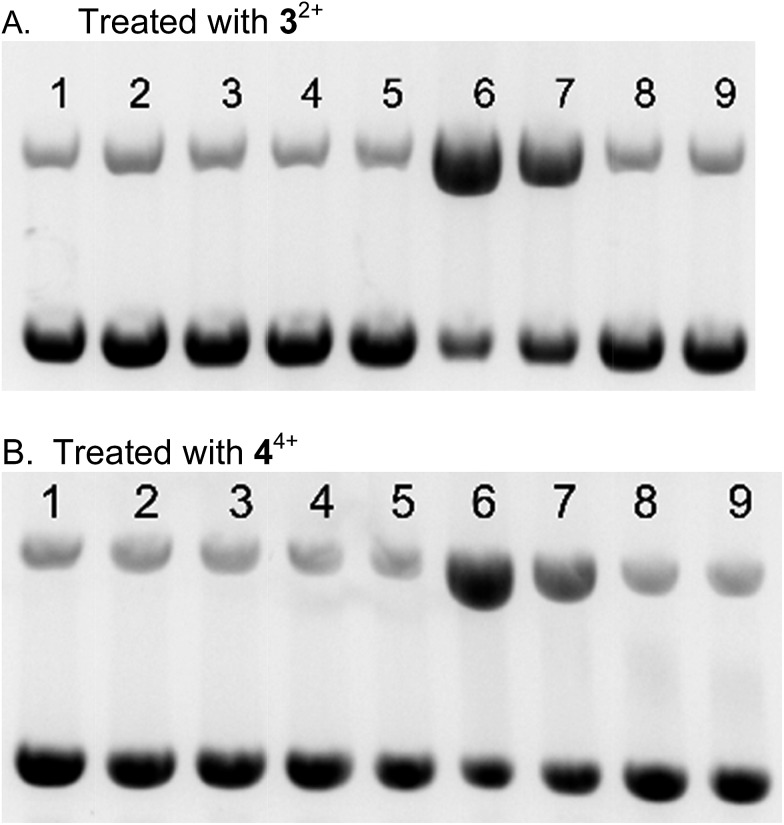
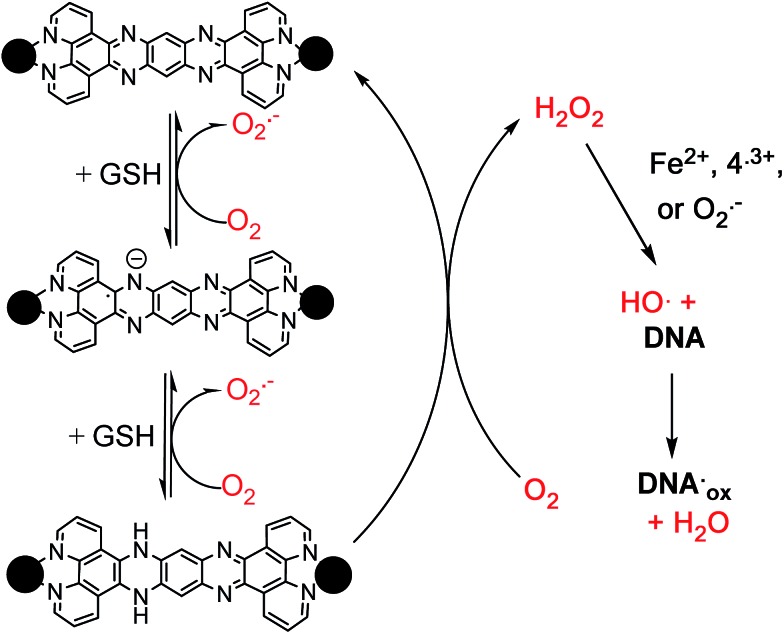
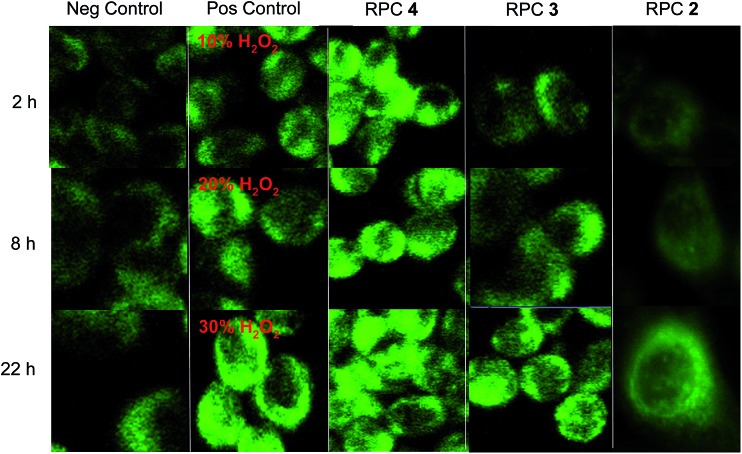
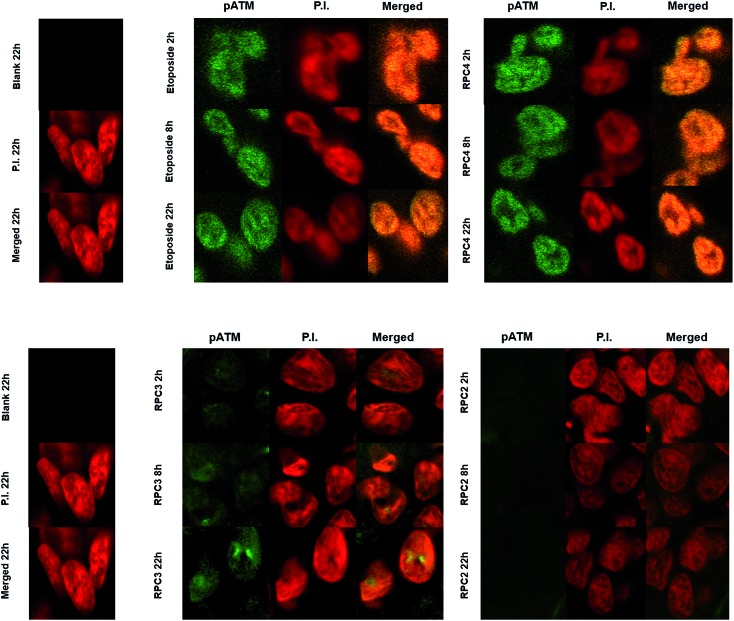
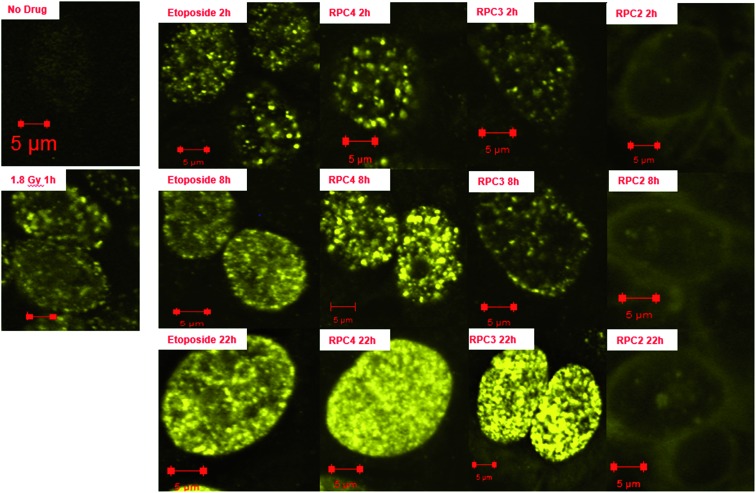
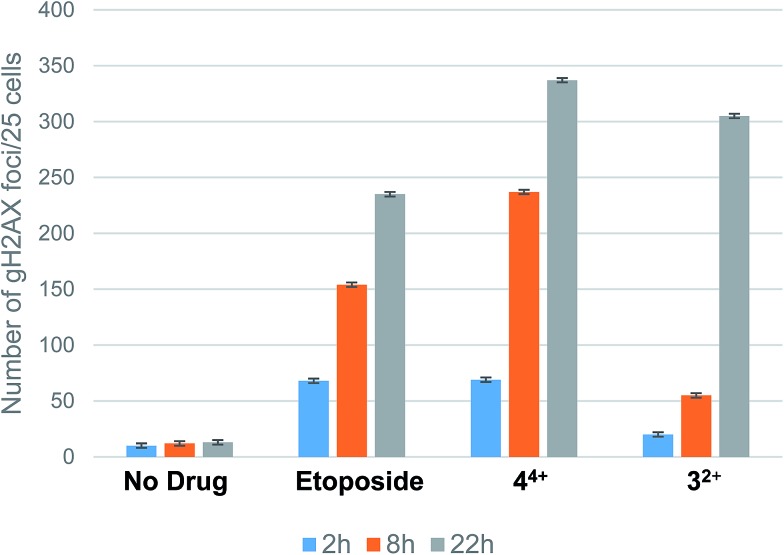
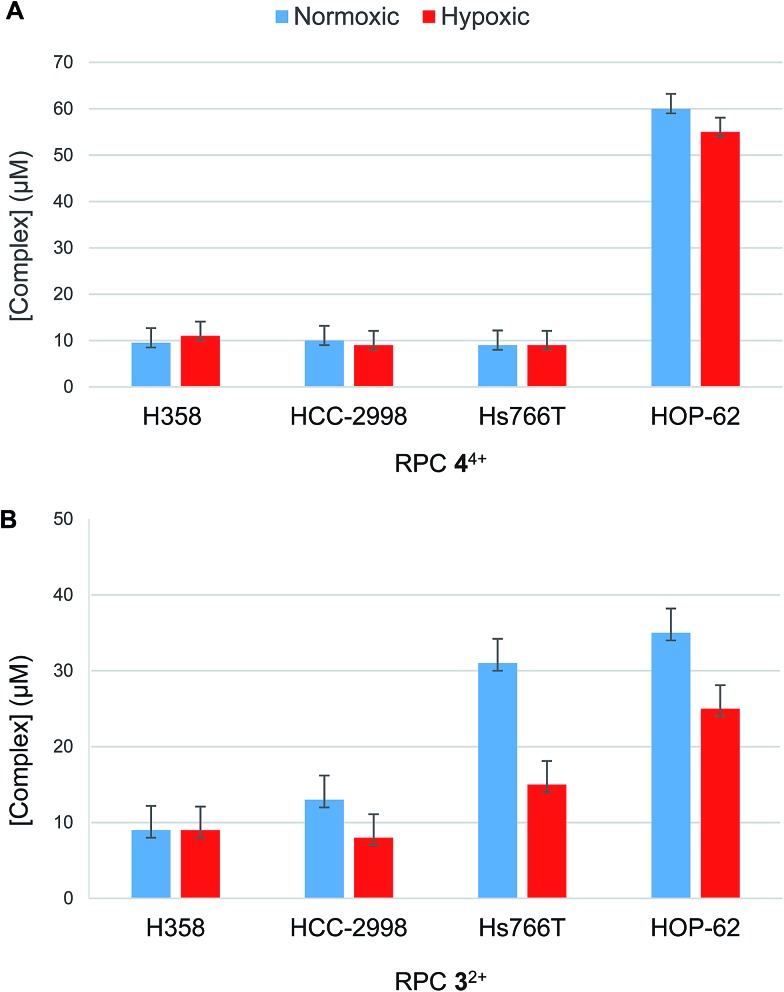
The ruthenium(ii) polypyridyl complexes (RPCs), [(phen)2Ru(tatpp)]2+ (32+ ) and [(phen)2Ru(tatpp)Ru(phen)2]4+ (44+ ) are shown to cleave DNA in cell-free studies in the presence of a mild reducing agent, i.e. glutathione (GSH), in a manner that is enhanced upon lowering the [O2]. Reactive oxygen species (ROS) are involved in the cleavage process as hydroxy radical scavengers attenuate the cleavage activity. Cleavage experiments in the presence of superoxide dismutase (SOD) and catalase reveal a central role for H2O2 as the immediate precursor for hydroxy radicals. A mechanism is proposed which explains the inverse [O2] dependence and ROS data and involves redox cycling between three DNA-bound redox isomers of 32+ or 44+ . Cultured non-small cell lung cancer cells (H358) are sensitive to 32+ and 44+ with IC50 values of 13 and 15 μM, respectively, and xenograft H358 tumors in nude mice show substantial (∼80%) regression relative to untreated tumors when the mice are treated with enantiopure versions of 32+ and 44+ (Yadav et al. Mol Cancer Res, 2013, 12, 643). Fluorescence microscopy of H358 cells treated with 15 μM 44+ reveals enhanced intracellular ROS production in as little as 2 h post treatment. Detection of phosphorylated ATM via immunofluorescence within 2 h of treatment with 44+ reveals initiation of the DNA damage repair machinery due to the ROS insult and DNA double strand breaks (DSBs) in the nuclei of H358 cells and is confirmed using the γH2AX assay. The cell data for 32+ is less clear but DNA damage occurs. Notably, cells treated with [Ru(diphenylphen)3]2+ (IC50 1.7 μM) show no extra ROS production and no DNA damage by either the pATM or γH2AX even after 22 h. The enhanced DNA cleavage under low [O2] (4 μM) seen in cell-free cleavage assays of 32+ and 44+ is only partially reflected in the cytotoxicity of 32+ and 44+ in H358, HCC2998, HOP-62 and Hs766t under hypoxia (1.1% O2) relative to normoxia (18% O2). Cells treated with RPC 32+ show up to a two-fold enhancement in the IC50 under hypoxia whereas cells treated with RPC 44+ gave the same IC50 whether under hypoxia or normoxia.
Figures
Similar articles
-
Synthesis, DNA Cleavage Activity, Cytotoxicity, Acetylcholinesterase Inhibition, and Acute Murine Toxicity of Redox-Active Ruthenium(II) Polypyridyl Complexes.ChemMedChem. 2017 Jul 6;12(13):1055-1069. doi: 10.1002/cmdc.201700240. Epub 2017 Jun 12. ChemMedChem. 2017. PMID: 28605571
-
Regression of lung cancer by hypoxia-sensitizing ruthenium polypyridyl complexes.Mol Cancer Ther. 2013 May;12(5):643-53. doi: 10.1158/1535-7163.MCT-12-1130. Epub 2013 Feb 26. Mol Cancer Ther. 2013. PMID: 23443803 Free PMC article.
-
Exploring the potential of highly charged Ru(II)- and heteronuclear Ru(II)/Cu(II)-polypyridyl complexes as antimicrobial agents.J Inorg Biochem. 2021 Jul;220:111467. doi: 10.1016/j.jinorgbio.2021.111467. Epub 2021 Apr 22. J Inorg Biochem. 2021. PMID: 33932708
-
Critical Overview of the Use of Ru(II) Polypyridyl Complexes as Photosensitizers in One-Photon and Two-Photon Photodynamic Therapy.Acc Chem Res. 2017 Nov 21;50(11):2727-2736. doi: 10.1021/acs.accounts.7b00180. Epub 2017 Oct 23. Acc Chem Res. 2017. PMID: 29058879 Review.
-
Considerations on the mechanism of action of artemisinin antimalarials: part 1--the 'carbon radical' and 'heme' hypotheses.Infect Disord Drug Targets. 2013 Aug;13(4):217-77. doi: 10.2174/1871526513666131129155708. Infect Disord Drug Targets. 2013. PMID: 24304352 Review.
Cited by
-
Ru(II) CONTAINING PHOTOSENSITIZERS FOR PHOTODYNAMIC THERAPY: A CRITIQUE ON REPORTING AND AN ATTEMPT TO COMPARE EFFICACY.Coord Chem Rev. 2022 Nov 1;470:214712. doi: 10.1016/j.ccr.2022.214712. Epub 2022 Jul 26. Coord Chem Rev. 2022. PMID: 36686369 Free PMC article.
-
The development of anticancer ruthenium(ii) complexes: from single molecule compounds to nanomaterials.Chem Soc Rev. 2017 Oct 2;46(19):5771-5804. doi: 10.1039/c7cs00195a. Chem Soc Rev. 2017. PMID: 28654103 Free PMC article. Review.
-
Metal Peptide Conjugates in Cell and Tissue Imaging and Biosensing.Top Curr Chem (Cham). 2022 Jun 15;380(5):30. doi: 10.1007/s41061-022-00384-8. Top Curr Chem (Cham). 2022. PMID: 35701677 Free PMC article. Review.
-
Antibacterial Activity of 2-Picolyl-polypyridyl-Based Ruthenium (II/III) Complexes on Non-Drug-Resistant and Drug-Resistant Bacteria.Bioinorg Chem Appl. 2021 May 20;2021:5563209. doi: 10.1155/2021/5563209. eCollection 2021. Bioinorg Chem Appl. 2021. PMID: 34093696 Free PMC article.
-
Effect of cyclic substituents on the anti-cancer activity and DNA interaction of ruthenium(II) bis-phenanthroline dipyridoquinoline.Front Mol Biosci. 2023 Oct 18;10:1252285. doi: 10.3389/fmolb.2023.1252285. eCollection 2023. Front Mol Biosci. 2023. PMID: 37920709 Free PMC article.
References
-
- Lebwohl D., Canetta R. Eur. J. Cancer. 1998;34:1522–1534. - PubMed
-
- Jung Y., Lippard S. J. Chem. Rev. 2007;107:1387–1407. - PubMed
-
- Farrell N. Compr. Coord. Chem. II. 2004;9:809–840.
-
- Meng X., Leyva M. L., Jenny M., Gross I., Benosman S., Fricker B., Harlepp S., Hebraud P., Boos A., Wlosik P., Bischoff P., Sirlin C., Pfeffer M., Loeffler J. P., Gaiddon C. Cancer Res. 2009;69:5458–5466. - PubMed
-
- Morris R. E., Aird R. E., Murdoch Pdel S., Chen H., Cummings J., Hughes N. D., Parsons S., Parkin A., Boyd G., Jodrell D. I., Sadler P. J. J. Med. Chem. 2001;44:3616–3621. - PubMed
LinkOut - more resources
Full Text Sources
Other Literature Sources
Research Materials
Miscellaneous