. 2017:2017:5463273.
doi: 10.1155/2017/5463273. Epub 2017 May 3.

Not Only Glycaemic But Also Other Metabolic Factors Affect T Regulatory Cell Counts and Proinflammatory Cytokine Levels in Women with Type 1 Diabetes

Affiliations

Not Only Glycaemic But Also Other Metabolic Factors Affect T Regulatory Cell Counts and Proinflammatory Cytokine Levels in Women with Type 1 Diabetes

Katerina Stechova et al. J Diabetes Res. 2017.

Abstract

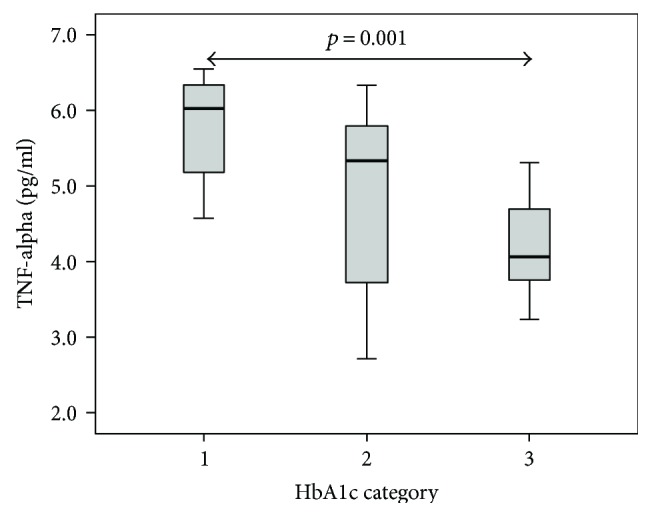
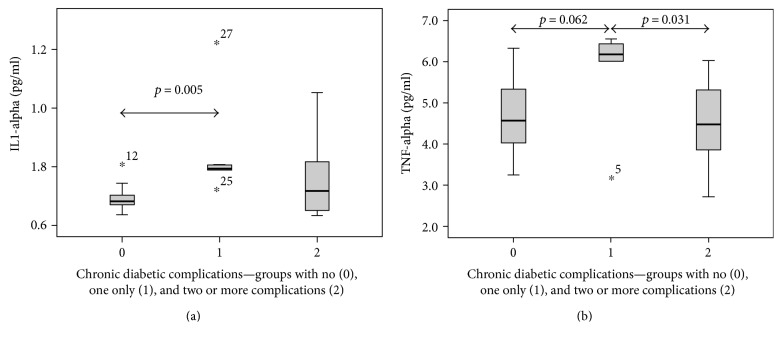
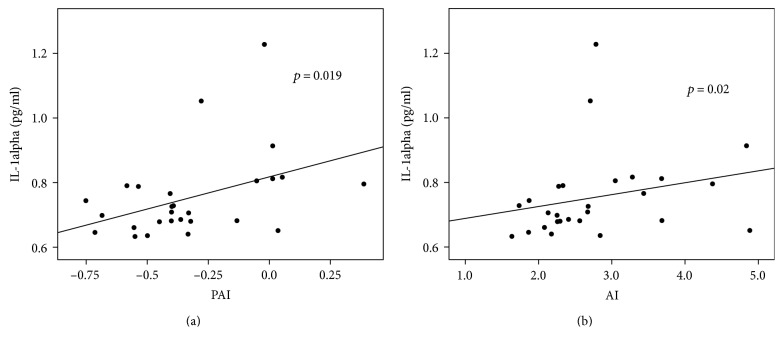
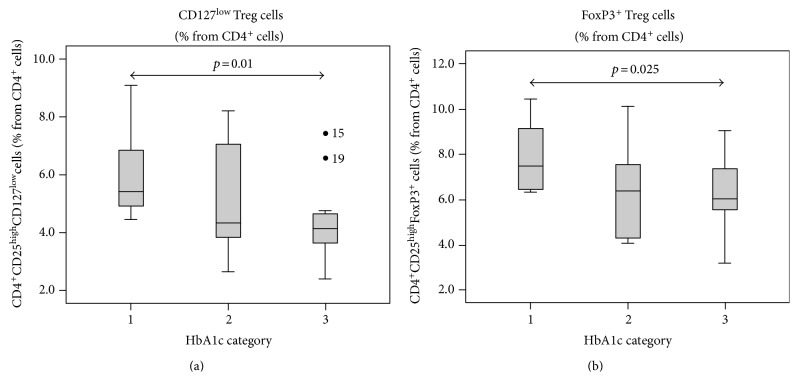
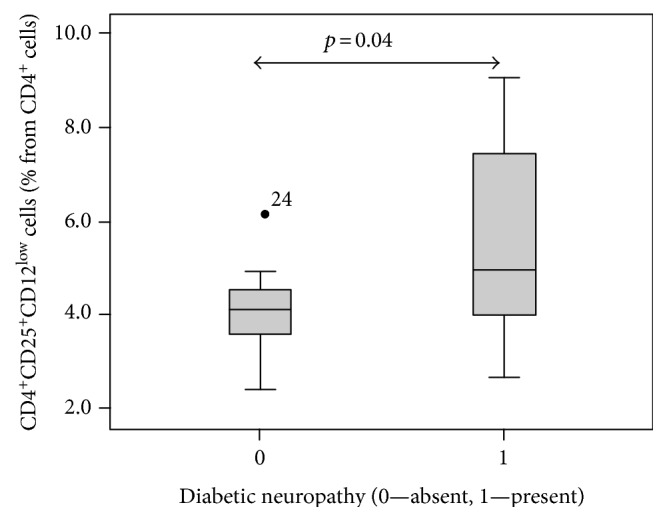
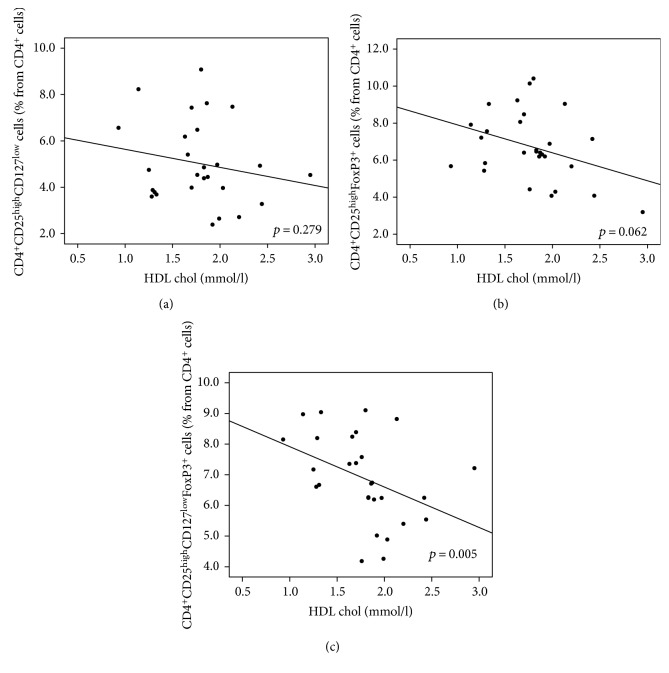
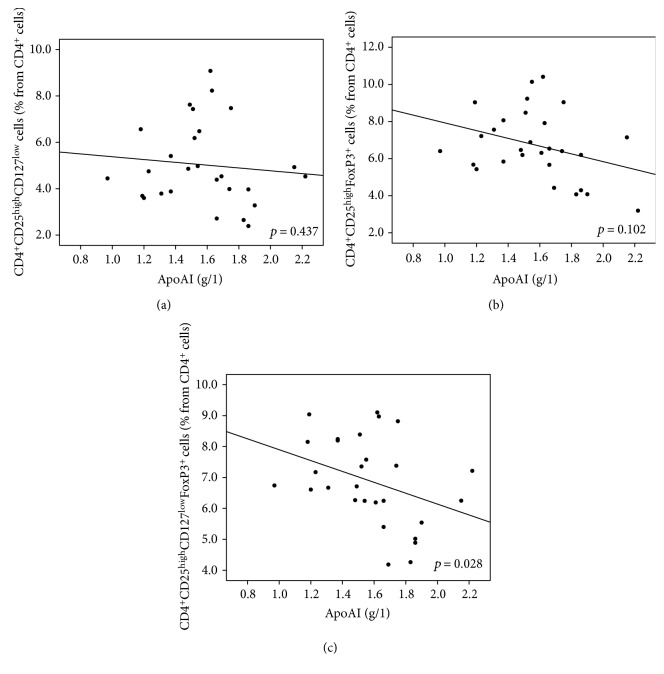
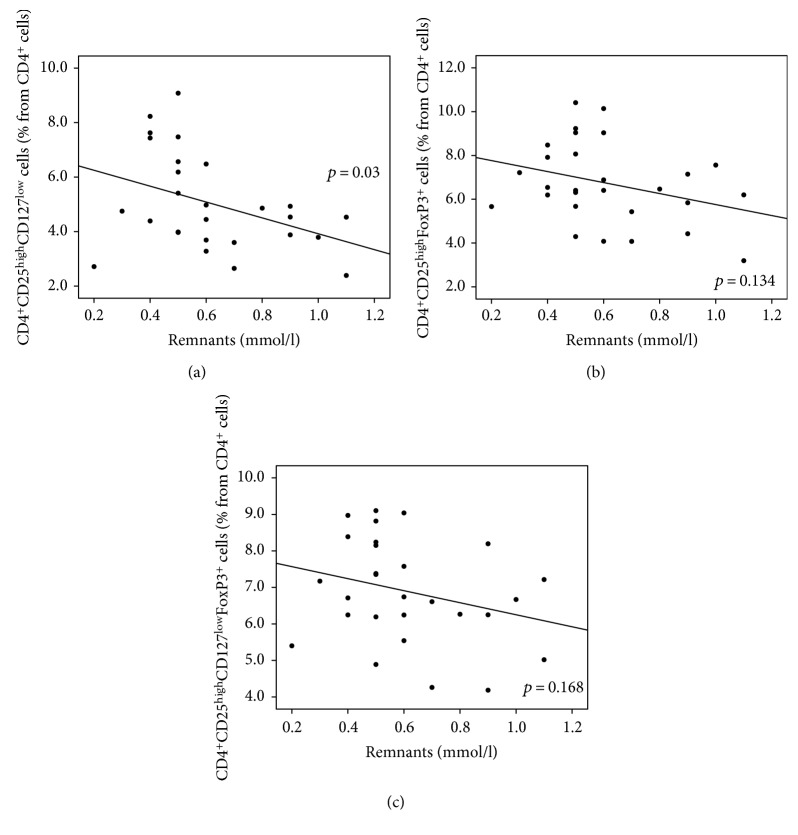
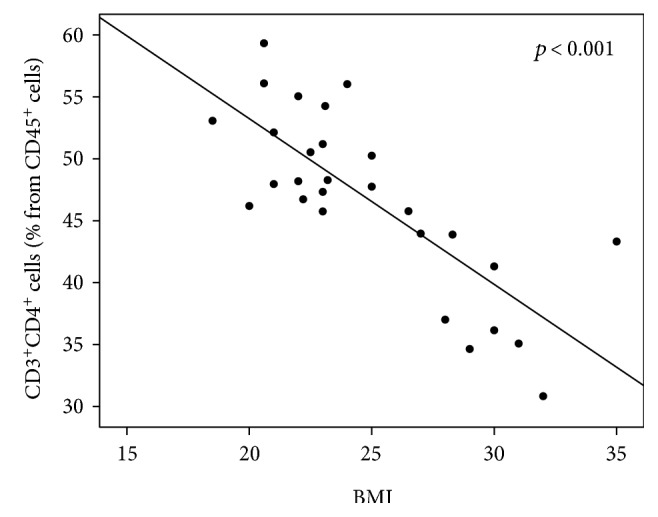
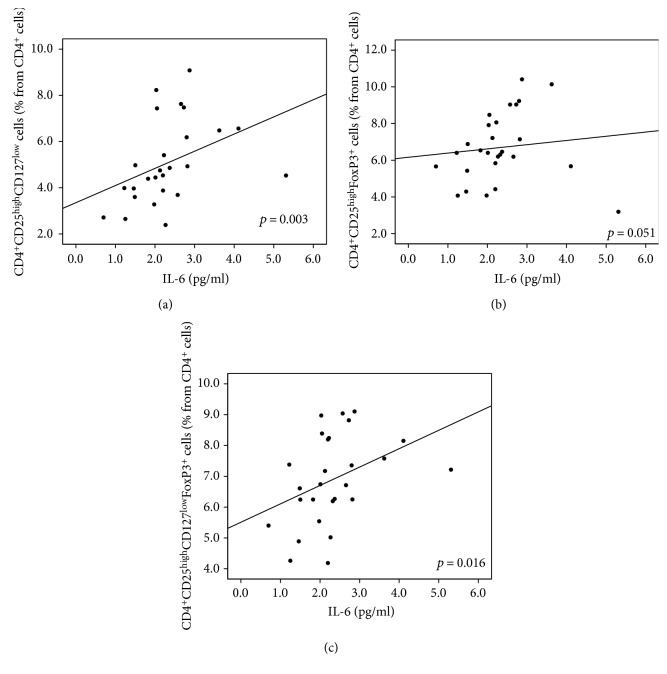
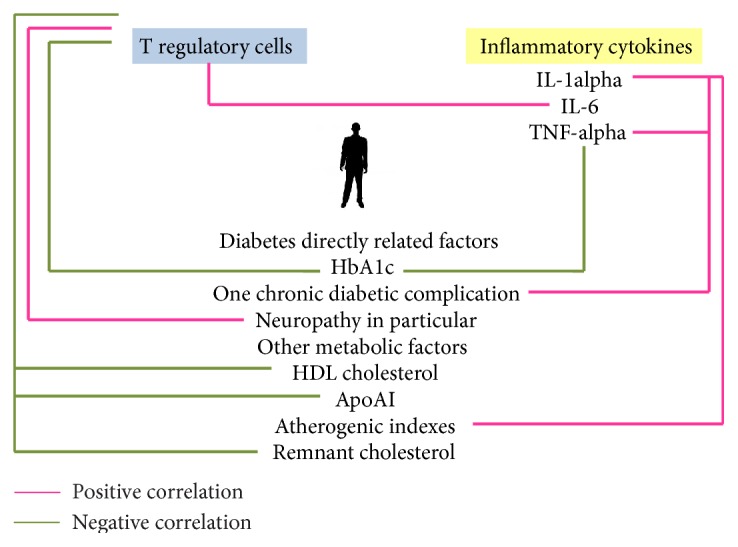
Type 1 diabetic (T1D) patients suffer from insulinopenia and hyperglycaemia. Studies have shown that if a patient's hyperglycaemic environment is not compensated, it leads to complex immune dysfunctions. Similarly, T1D mothers with poor glycaemic control exert a negative impact on the immune responses of their newborns. However, questions concerning the impact of other metabolic disturbances on the immune system of T1D mothers (and their newborns) have been raised. To address these questions, we examined 28 T1D women in reproductive age for the relationship between various metabolic, clinical, and immune parameters. Our study revealed several unexpected correlations which are indicative of a much more complex relationship between glucose and lipid factors (namely, glycosylated haemoglobin Hb1Ac, the presence of one but not multiple chronic diabetic complications, and atherogenic indexes) and proinflammatory cytokines (IL-1alpha and TNF-alpha). Regulatory T cell counts correlated with HbA1c, diabetic neuropathy, lipid spectra parameters, and IL-6 levels. Total T-helper cell count was interconnected with BMI and glycaemia variability correlated with lipid spectra parameters, insulin dose, and vitamin D levels. These and other correlations revealed in this study provide broader insight into the association of various metabolic abnormalities with immune parameters that may impact T1D mothers or their developing child.


Figures

Figure 1
Figure 1
Inflammatory cytokines and HbA1c category. Patients with the worst diabetes stabilization (evaluated according to glycosylated haemoglobin HbA1c) had surprisingly the lowest level of proinflammatory cytokine TNF-alpha. There was a significant difference between this subgroup (marked as category 3) and the subgroup of patients with the best HbA1c (marked as category 1).
Figure 2
Figure 2
Inflammatory cytokines and chronic diabetic complications. The highest production of IL-1alpha was observed in patients with one chronic diabetic complication which significantly differed from patients without any diabetic complications. TNF-alpha expression levels were similar to those seen for IL-1alpha, but in addition, patients with multiple complications had significantly lower levels of TNF-alpha than those with only one complication. (a) IL-1alpha. (b) TNF-alpha—the highest TNF-alpha production was also observed in patients with one chronic diabetic complication.
Figure 3
Figure 3
Inflammatory cytokines and calculated lipid indexes. Patients with higher calculated PAI and AI lipid indexes exhibited a significantly higher production of proinflammatory cytokine IL-1alpha (p = 0.019 and R = 0.449 for PAI and p = 0.02 and R = 0.446 for AI, resp.). (a) IL-1alpha and PAI (plasma atherogenic index). (b) IL-1alpha and AI (atherogenic index).
Figure 4
Figure 4
T regulatory cells and HbA1c category. The lowest count of Treg cells was determined in the group of patients with poor diabetes stabilization with the highest HbA1c levels (category 3) and differed significantly from that with the lowest HbA1c, independently whether Treg marker CD127low or FoxP3 was used.
Figure 5
Figure 5
The presence of diabetic neuropathy and CD127low Treg cells. Patients suffering from diabetic neuropathy showed a significantly higher number of CD127low Treg cells than patients with no complications.
Figure 6
Figure 6
(a–c) The relationship between T regulatory cells and HDL level. Higher level of HDL cholesterol correlated with lower Treg numbers. This correlation was significant in the case of CD127lowFoxP3+ cells (p = 0.005, R = −0.52). The same trend was observed for both CD127low and FoxP3+ Treg cells but failed to reach significant levels (p = 0.279 and R = −0.216 for CD127low Treg cells and p = 0.062 and R = −0.357 for FoxP3+ Treg cells). (a) CD127low Treg cells (% from CD4+cells). (b) FoxP3+ Treg cells (% from CD4+cells). (c) CD127lowFoxP3+ cells (% from CD4+cells).
Figure 7
Figure 7
(a–c) The relationship between T regulatory cells and ApoAI. Higher level of ApoAI correlated with lower Treg numbers. This correlation was significant in the case of CD127lowFoxP3+ cells (p = 0.028, R = −0.416). The same trend was observed for both FoxP3+ and CD127low Treg cells but failed to reach significant levels (p = 0.102, R = −0.315 and p = 0.437, R = −0.156, resp.). (a) CD127low Treg cells (% from CD4+cells). (b) FoxP3+ Treg cells (% from CD4+cells). (c) CD127lowFoxP3+ Treg cells (% from CD4+cells).
Figure 8
Figure 8
(a–c) The relationship between T regulatory cells and calculated “remnant cholesterol”. Higher calculated remnant cholesterol was correlated to lower Treg numbers. This correlation was significant in the case of CD127low Treg cells (p = 0.03, R = −0.418). The similar trend was observed for FoxP3+ as well as for CD127lowFoxP3+ Treg cells that failed to reach statistical significance (p = 0.134, R = −0.29 and p = 0.168, R = −0.268, resp.). (a) CD127low Treg cells (% from CD4+cells). (b) FoxP3+ Treg cells (% from CD4+cells). (c) CD127lowFoxP3+ Treg cells (% from CD4+cells).
Figure 9
Figure 9
The inverse relationship between CD3+CD4+ cells (% from CD45+cells) and BMI. Patients with higher BMI had significantly lower numbers of CD3+CD4+ cells (shown as % from CD45+ cells). p < 0.001, R = −0.65.
Figure 10
Figure 10
(a–c) T regulatory cells and IL-6. Higher Treg cell count correlated with higher level of proinflammatory cytokine IL-6. This relationship reached significance in the case of CD127low Treg cells (p = 0.003, R = 0.551) and CD127lowFoxP3+ Treg cells (p = 0.016, R = 0.458). The same trend with a borderline significance was observed for FoxP3+ Treg cells (p = 0.051, R = 0.379). (a) CD127low Treg cells (% from CD4+cells). (b) FoxP3+ Treg cells (% from CD4+cells). (c) CD127lowFoxP3+ Treg cells (% from CD4+cells).
Figure 11
Figure 11
Regulatory T cell count positively correlated with the presence of neuropathy and with IL-6 level. Negative relationship was observed between regulatory T cell count and HbA1c level, HDL, ApoAI, and remnant cholesterol. IL-1alpha level was positively connected with the presence of one chronic diabetic complication (the same stands for TNF-alpha) as well as to calculated atherogenic indexes. We observed a negative relationship between TNF-alpha and HbA1c level.

Similar articles

Cited by

References

    1. Atkinson M. A., Kaufman D. L., Campbell L., et al. Response of peripheral-blood mononuclear cells to glutamate decarboxylase in insulin-dependent diabetes. Lancet. 1992;339(8791):458–459. doi: 10.1016/0140-6736(92)91061-C. - DOI - PubMed
    1. McDaniel C. F. Diabetes: a model of oxidative accelerated aging. Age (Omaha) 1999;22(4):145–148. doi: 10.1007/s11357-999-0016-1. - DOI - PMC - PubMed
    1. Polsky S., Ellis S. L. Obesity, insulin resistance, and type 1 diabetes mellitus. Current Opinion in Endocrinology, Diabetes, and Obesity. 2015;22(4):277–282. doi: 10.1097/MED.0000000000000170. - DOI - PubMed
    1. Kurien M., Mollazadegan K., Sanders D. S., Ludvigsson J. F. Celiac disease increases risk of thyroid disease in patients with type 1 diabetes: a nationwide cohort study. Diabetes Care. 2016;39(3):371–375. doi: 10.2337/dc15-2117. - DOI - PubMed
    1. Stechova K., Spalova I., Durilova M., et al. Influence of maternal hyperglycaemia on cord blood mononuclear cells in response to diabetes-associated autoantigens. Scandinavian Journal of Immunology. 2009;70(2):149–158. doi: 10.1111/j.1365-3083.2009.02282.x. - DOI - PubMed

MeSH terms

LinkOut - more resources