. 2017 Jul;35(7):640-646.
doi: 10.1038/nbt.3880. Epub 2017 May 29.

Single-cell genome sequencing at ultra-high-throughput with microfluidic droplet barcoding

Affiliations

Single-cell genome sequencing at ultra-high-throughput with microfluidic droplet barcoding

Freeman Lan et al. Nat Biotechnol. 2017 Jul.

Abstract

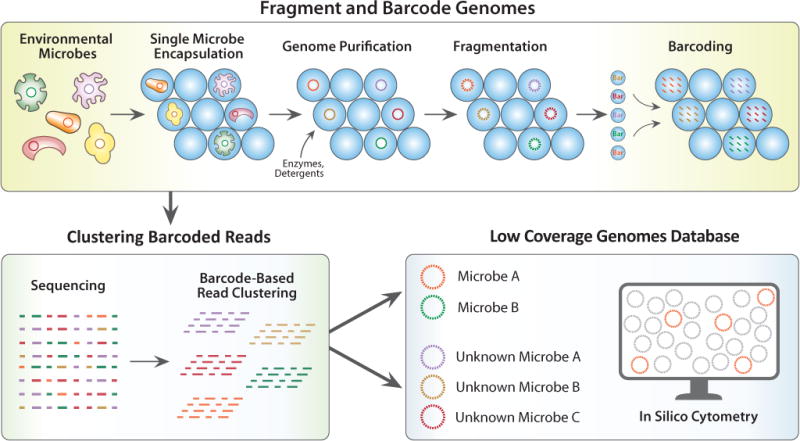
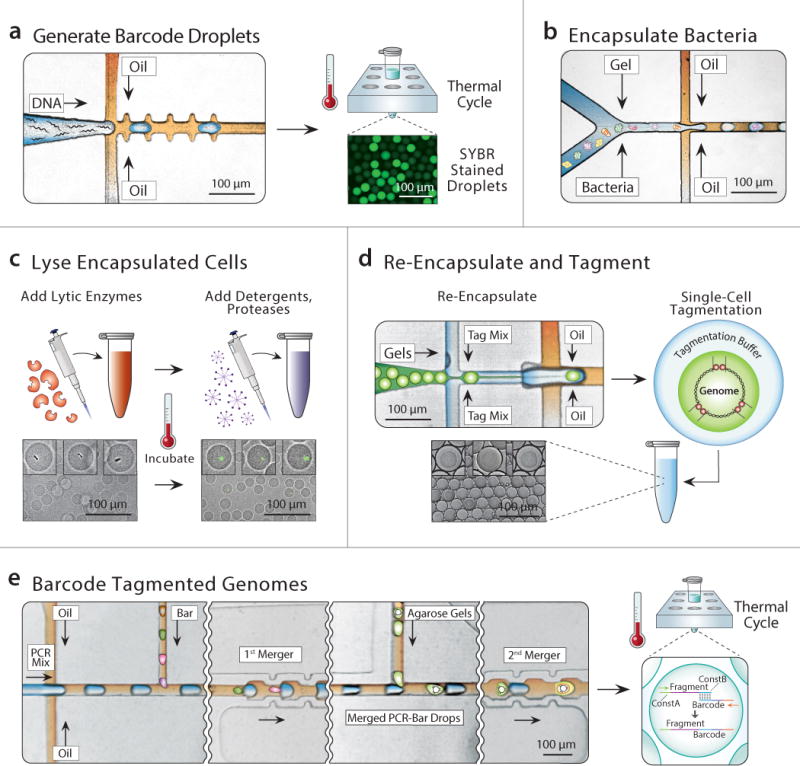
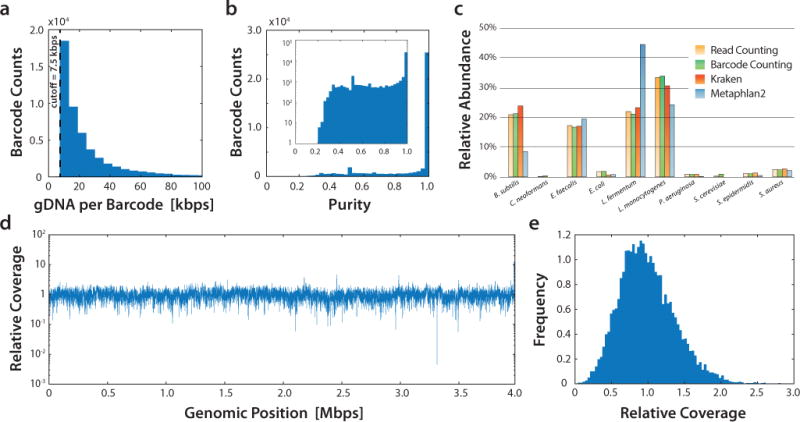
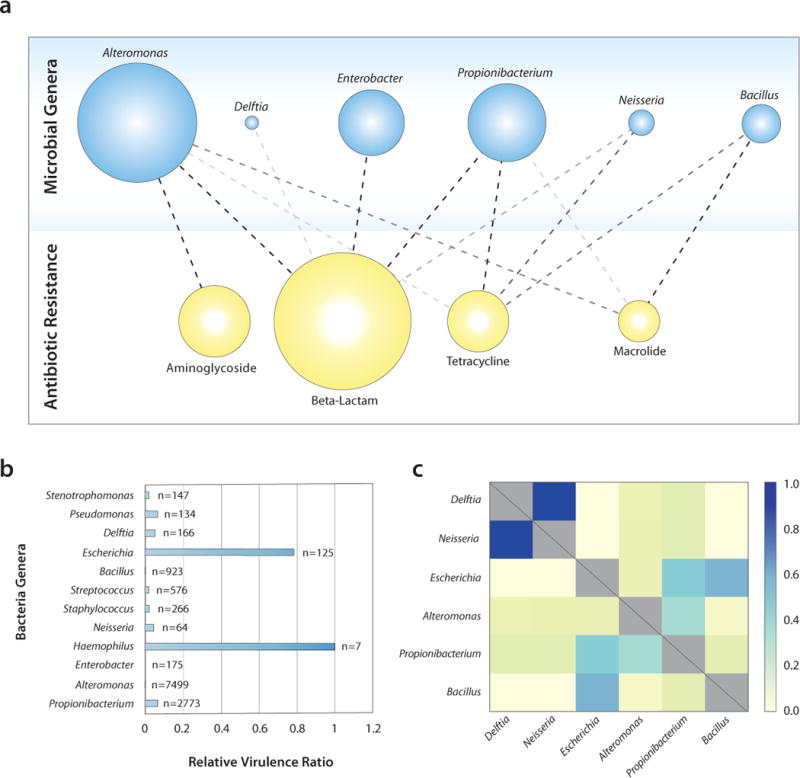
The application of single-cell genome sequencing to large cell populations has been hindered by technical challenges in isolating single cells during genome preparation. Here we present single-cell genomic sequencing (SiC-seq), which uses droplet microfluidics to isolate, fragment, and barcode the genomes of single cells, followed by Illumina sequencing of pooled DNA. We demonstrate ultra-high-throughput sequencing of >50,000 cells per run in a synthetic community of Gram-negative and Gram-positive bacteria and fungi. The sequenced genomes can be sorted in silico based on characteristic sequences. We use this approach to analyze the distributions of antibiotic-resistance genes, virulence factors, and phage sequences in microbial communities from an environmental sample. The ability to routinely sequence large populations of single cells will enable the de-convolution of genetic heterogeneity in diverse cell populations.


Figures

Figure 1
Figure 1. Schematic of SiC-seq workflow
Top: Droplet workflow to generate single cell genome barcoded sequencing library. Bottom Left: Sequencing and generation of barcode groups representing reads from single cells. Bottom Right: The groups of reads comprise a database of low coverage genomes of single cells, which can be searched repeatedly in silico.
Figure 2
Figure 2. Microfluidic and biochemical workflow to generate a SiC-seq library
a) Generating barcode droplets by encapsulating random DNA oligos at limiting dilution and amplification by in-droplet PCR (SYBR stained for visualization). b) Cells are encapsulated at limiting dilution with molten agarose to generate single cell containing agarose microgels. c) The single cell genomes are purified through a series of bulk enzymatic and detergent lysis steps (see Online Methods). d) Microgels are re-encapsulated in droplets containing tagmentation reagents. e) The droplets containing tagmented genomes are merged sequentially with PCR reagents and barcode droplets at a 1:1 ratio, followed by PCR to splice barcodes to genomic fragments.
Figure 3
Figure 3. SiC-seq performance on an artificial microbial community consisting of ten different cell species
a) Distribution of sequencing yield of each barcode group. b) Histogram of the purity of each barcode group, which is defined as the fraction of reads mapping to the most mapped species for that group. The inset is plotted with the counts on a logarithmic scale. c) Relative abundance estimates of each species using read counting, barcode counting, and two different taxonomic profiling programs (Kraken and Metaphlan2). d) Relative coverage of the Bacillus subtilis genome for all Bacillus subtilis barcode groups, showing good uniformity. See Supplemental Fig. 8 for coverage maps of other species. e) Coverage histogram for the Bacillus subtilis genome binned by relative coverage.
Figure 4
Figure 4. Application of SiC-seq to a marine community recovered from the San Francisco coastline
a) Distribution of antibiotic resistance genes according to genus of host microbe. The opacity of connecting lines reflects the number of interactions detected in the database. b) Relative abundance of virulence factors in each genus detected in the community. c) Relative potential for transduction between bacterial taxa, determined by the relative number of common phage sequences detected in their respective genomes, plotted as a heat map.

Comment in

References

    1. Monte UD. Does the cell number 109 still really fit one gram of tumor tissue? Cell Cycle. 2009;8:505–506. - PubMed
    1. Maranger Roxane, Bird David. viral abundance in aquatic systems: a comparison between marine and fresh waters. Mar Ecol Prog Ser. 1995;121:217–226.
    1. Zhang H, Liu KK. Optical tweezers for single cells. J R Soc Interface. 2008;5:671–690. - PMC - PubMed
    1. Rinke C, et al. Obtaining genomes from uncultivated environmental microorganisms using FACS–based single-cell genomics. Nat Protoc. 2014;9:1038–1048. - PubMed
    1. Gawad C, Koh W, Quake SR. Dissecting the clonal origins of childhood acute lymphoblastic leukemia by single-cell genomics. Proc Natl Acad Sci U S A. 2014;111:17947–17952. - PMC - PubMed

Publication types

MeSH terms