. 2017 Oct 5;36(40):5593-5608.
doi: 10.1038/onc.2017.146. Epub 2017 May 29.

ATF4 promotes angiogenesis and neuronal cell death and confers ferroptosis in a xCT-dependent manner

Affiliations

ATF4 promotes angiogenesis and neuronal cell death and confers ferroptosis in a xCT-dependent manner

D Chen et al. Oncogene. .

Abstract

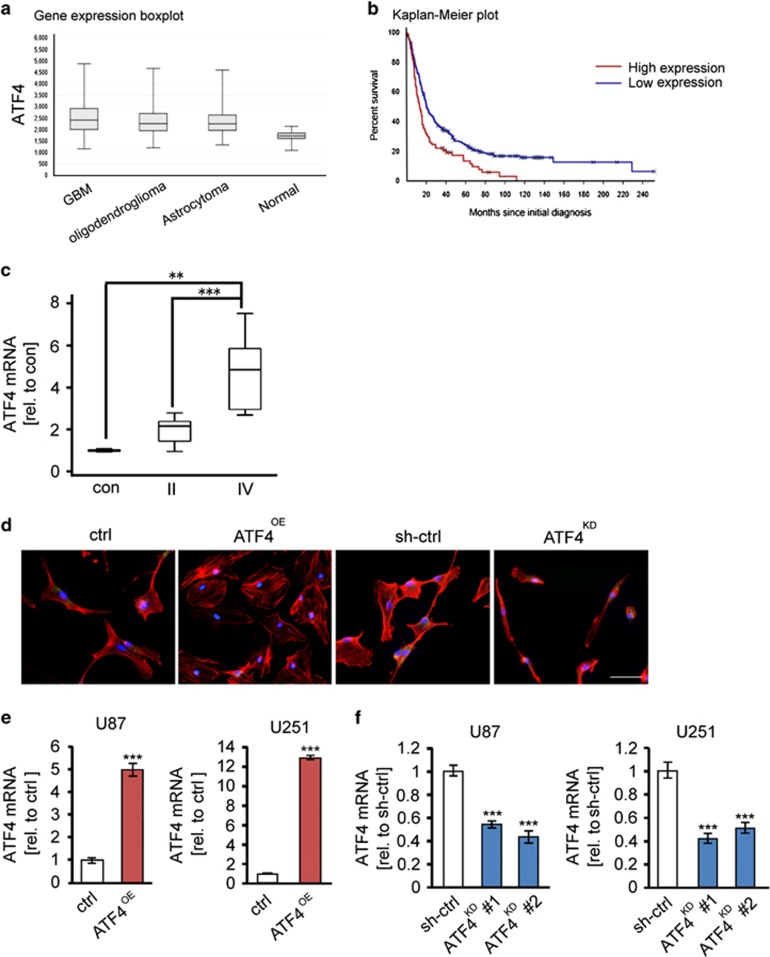
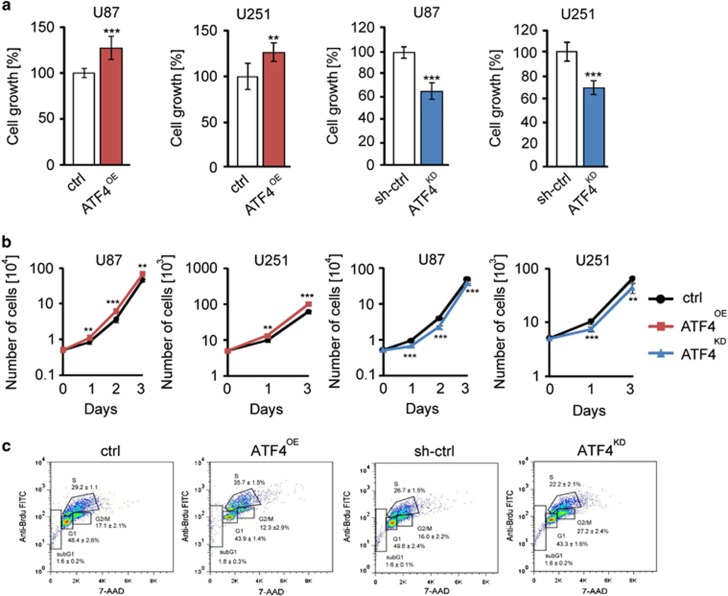
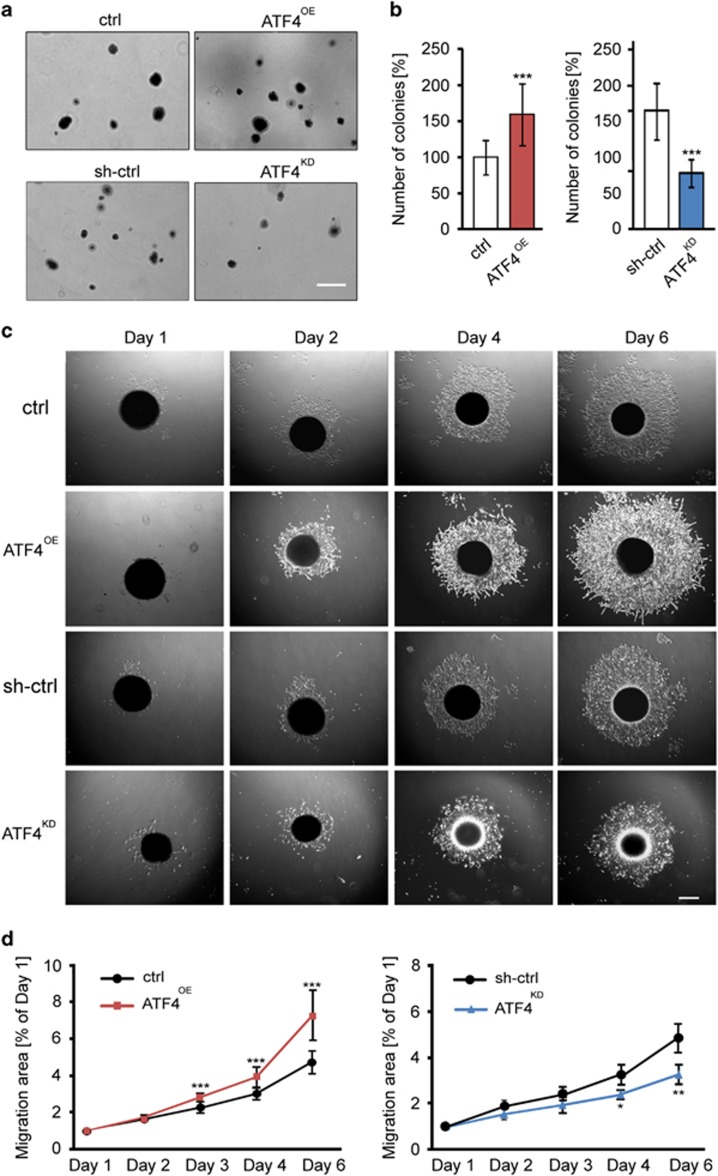
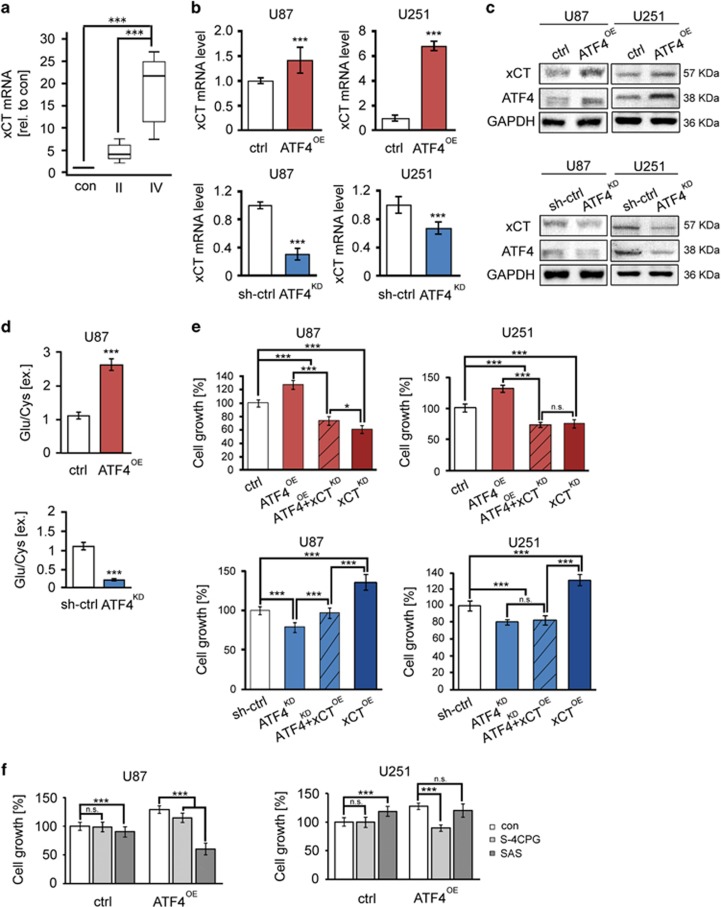
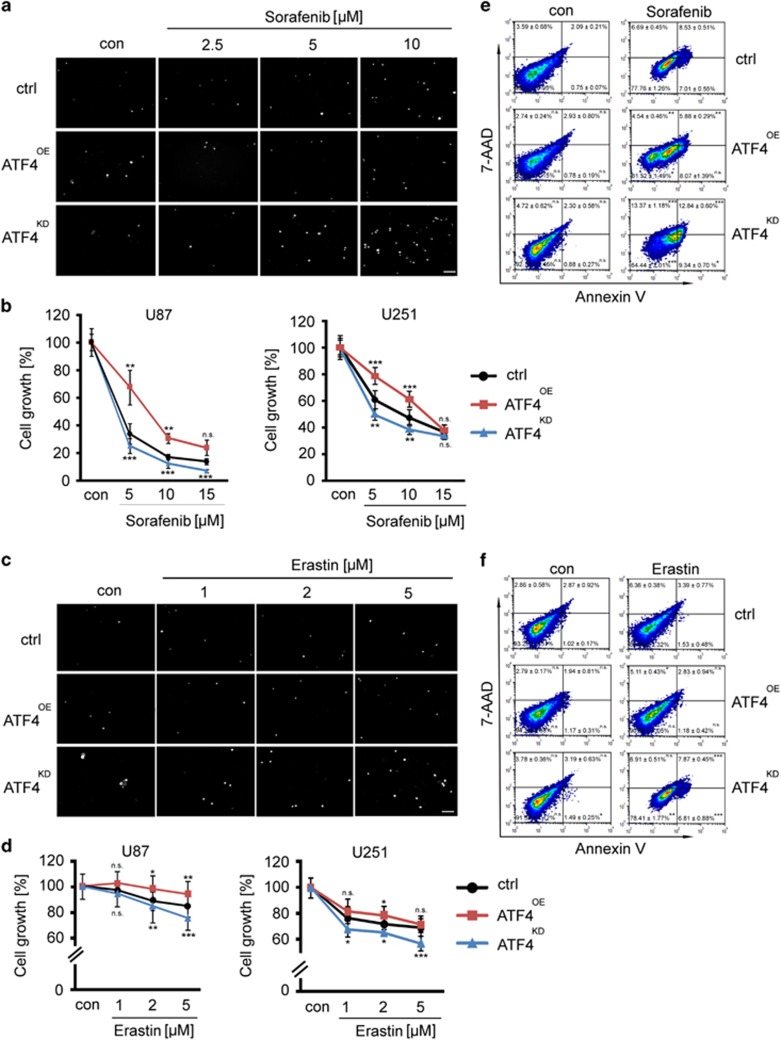
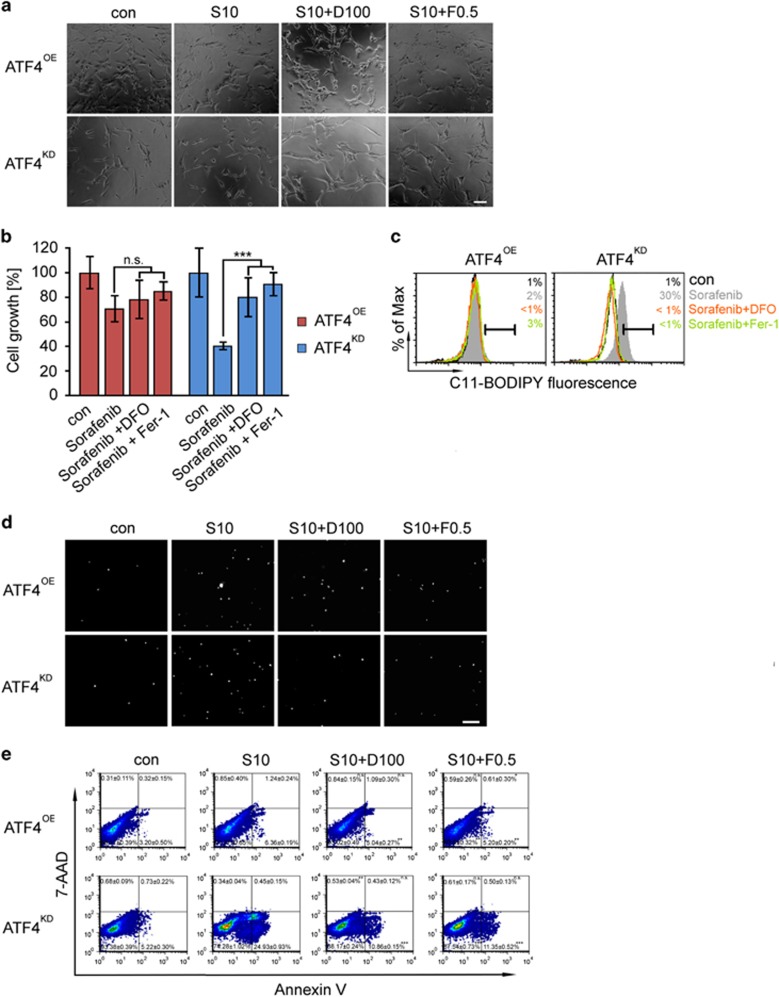
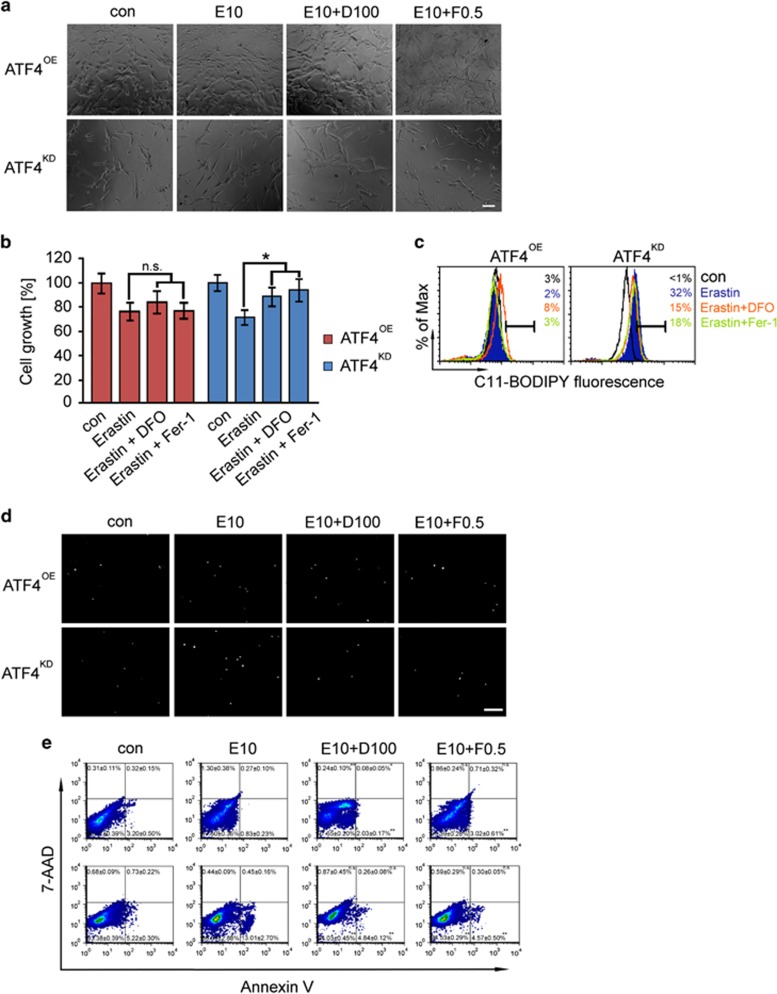
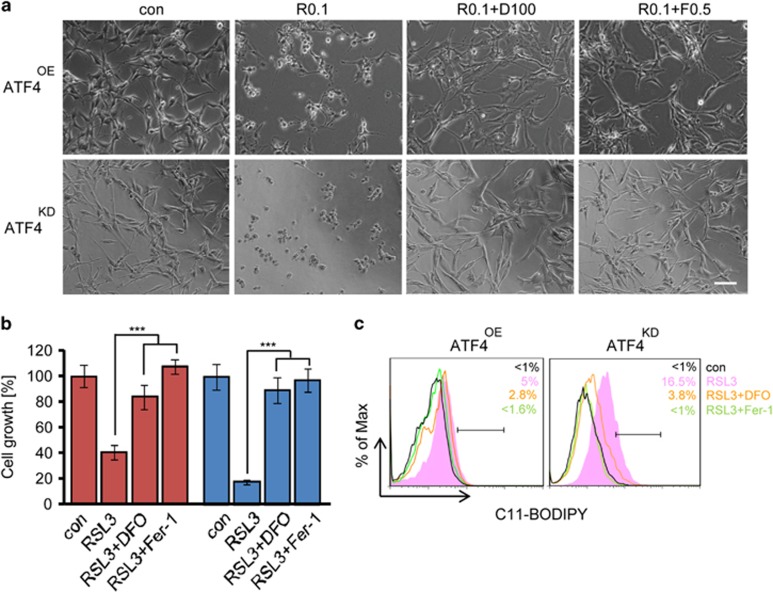
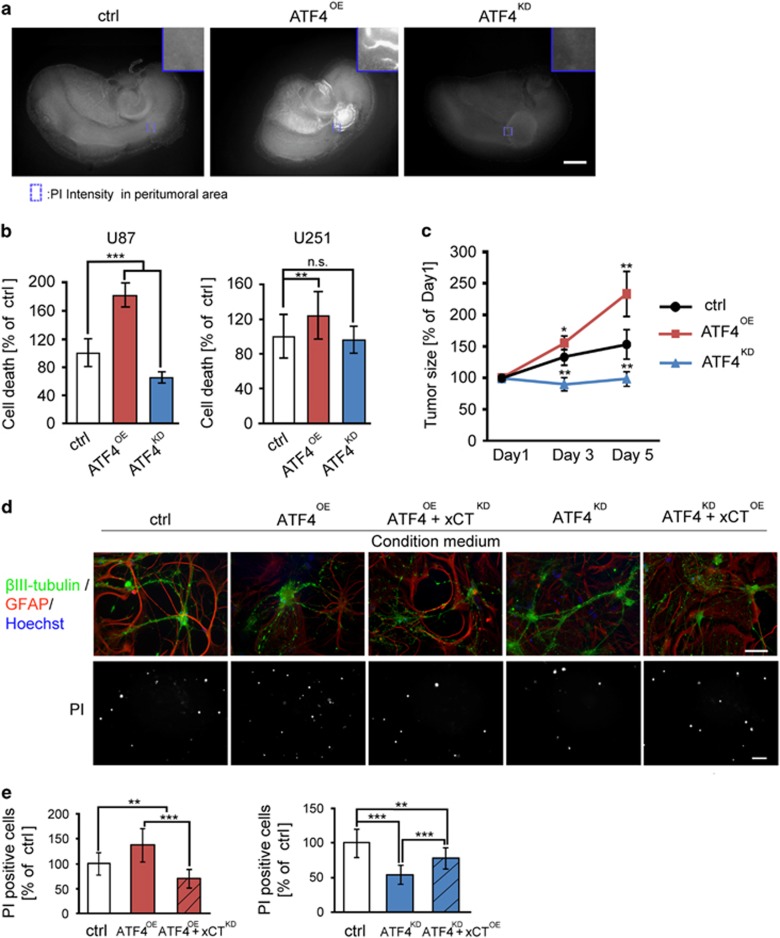
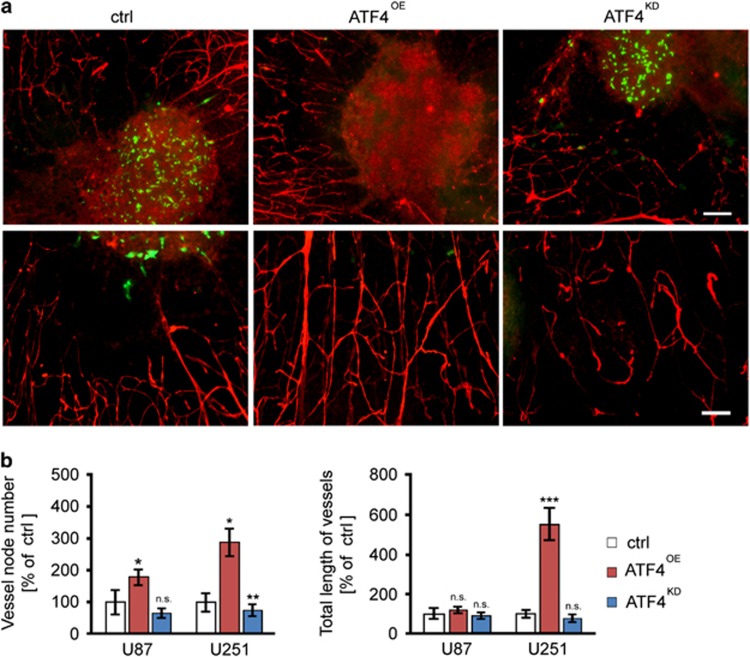
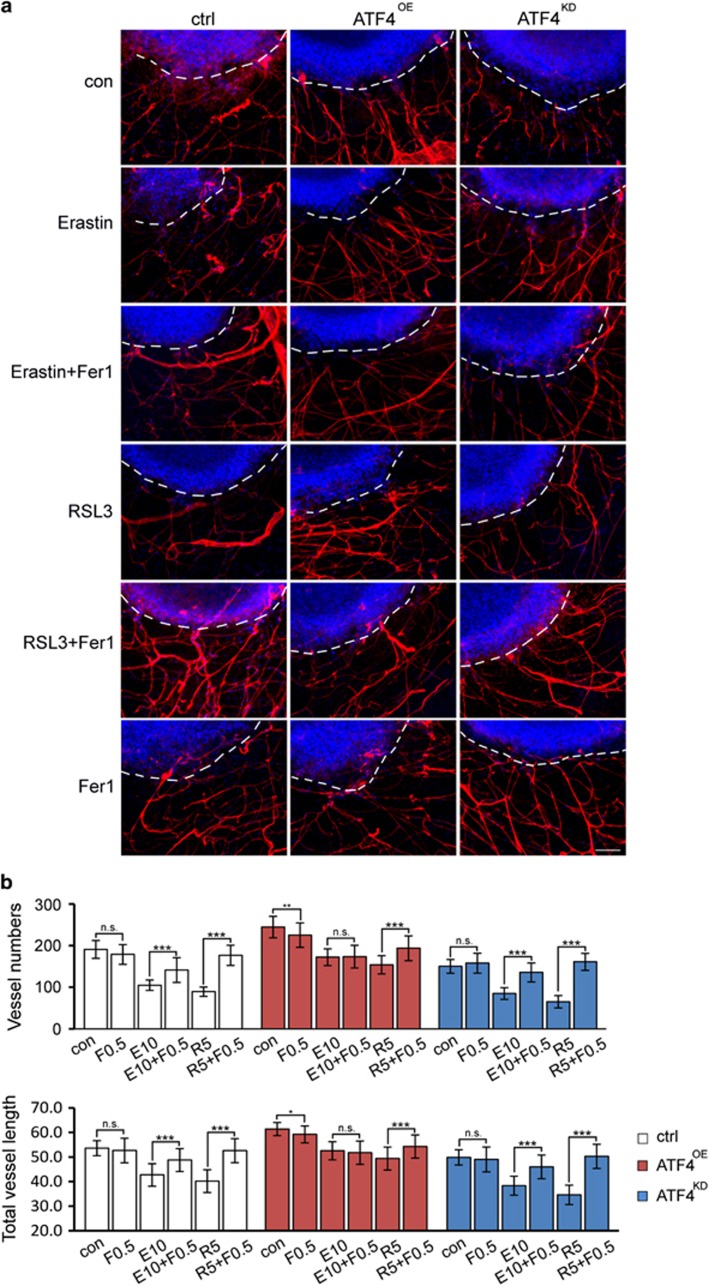
Activating transcription factor 4 (ATF4) is a critical mediator of metabolic and oxidative homeostasis and cell survival. ATF4 is elevated in response to diverse microenvironmental stresses, including starvation, ER stress damages and exposure to toxic factors. Here we show that ATF4 expression fosters the malignancy of primary brain tumors (WHO grade III and IV gliomas) and increases proliferation and tumor angiogenesis. Hence, ATF4 expression promotes cell migration and anchorage-independent cell growth, whereas siRNA-mediated knockdown of ATF4 attenuates these features of malignancy in human gliomas. Further experiments revealed that ATF4-dependent tumor promoting effects are mediated by transcriptional targeting the glutamate antiporter xCT/SCL7A11 (also known as system Xc-). Thus, xCT is elevated as a consequence of ATF4 activation. We further found evidence that ATF4-induced proliferation can be attenuated by pharmacological or genetic xCT inhibition and ferroptosis inducers such as sorafenib, erastin and GPx4 inhibitor RSL3. Further, fostered xCT expression promotes cell survival and growth in ATF4 knockdown cells. Moreover, increased xCT levels ameliorate sorafenib and erastin-induced ferroptosis. Conversely, ATF4 knockdown renders cells susceptible for erastin, sorafenib and RSL3-induced ferroptosis. We further identified that ATF4 promotes tumor-mediated neuronal cell death which can be alleviated by xCT inhibition. Moreover, elevated ATF4 expression in gliomas promotes tumor angiogenesis. Noteworthy, ATF4-induced angiogenesis could be diminished by ferroptosis inducers erastin and by GPx4 inhibitor RSL3. Our data provide proof-of-principle evidence that ATF4 fosters proliferation and induces a toxic microenvironmental niche. Furthermore, ATF4 increases tumor angiogenesis and shapes the vascular architecture in a xCT-dependent manner. Thus, inhibition of ATF4 is a valid target for diminishing tumor growth and vasculature via sensitizing tumor cells for ferroptosis.


Conflict of interest statement

The authors declare no conflict of interest.

Figures

Figure 1
Figure 1
ATF4 expression is associated with human malignant gliomas and changes the morphology of glioma cells. (a) Oncomine database analysis of different human primary brain tumor entities. Expression of ATF4 mRNA is higher in astrocytoma (n=148), GBM (n=228) and oligodendroglioma (n=67) compared to that of non-tumor tissue (n=28). ***P<0.001, Student’s t-test. (b) Kaplan–Meier survival analysis (Rembrandt Glioma Dataset) of high versus low ATF4-expressing gliomas. P<0.001, log-rank test. (c) ATF4 mRNA and xCT mRNA in human glioblastoma (WHO° II, n=12; WHO° IV, n=15) and normal brain (con, n=3) samples were evaluated by RT-PCR. ***P<0.001, Student’s t-test. (d) Morphology of U87 cells expressing GFP (ctrl), pSuper-GFP (sh-ctrl), ATF4 overexpression (ATF4OE) and shRNA-mediated ATF4 knockdown (ATF4KD) stained for actin (red) and nuclei (Hoechst 33342, blue). Scale bar represents 50 μm. ATF4OE cells show polymorphic cell shape and are generally bigger in size than ATF4KD and control cells. ATF4KD glioma cells are smaller compared to ATF4OE and control cells. (e, f) Quantification of ATF4 mRNA expression in ATF4 overexpression and shRNA-mediated knockdown glioma cells (U87, U251) via quantitative RT-PCR (n=3). Statistical significance was calculated with Student’s t-test (mean±s.d., ***P<0.001).
Figure 2
Figure 2
ATF4 promotes glioma cell growth. (a) ATF4 depletion slowed down glioma cell growth. Cell growth was determined by MTT assay (n=8). Statistical significance was calculated with Student’s t-test (mean±s.d., **P<0.01; ***P<0.001). (b) Quantification of cell growth over time. 5000 cells were seeded per well in 12-well plates and counted for 3 days (n=6). Statistical significance was calculated with Student’s t-test (mean±s.d., **P<0.01; ***P<0.001). (c) Cell cycle profile of ATF4OE and ATF4KD U87 cells was monitored with 7-AAD (n=3) (bottom). Quantification of the sub G1, G1, S and G2/M percentage in ATF4OE, ATF4KD, and respective control cells shown in (c). Statistical significance was calculated with Student’s t-test (given are mean±s.d., *P<0.05; **P<0.01; ***P<0.001). BrdU incorporation and 7-AAD staining of ATF4OE and ATF4KD U87 cells was analyzed by flow cytometry (n=3). ATF4KD cells showed prolonged G2/M phase.
Figure 3
Figure 3
ATF4 fosters anchorage-independent cell growth and migration. (a) Soft agar colony-forming assay with controls (crtl), ATF4OE and ATF4KD U87 cells. Representative images show colonies after 21 days post seeding. Scale bar represents 100 μm. (b) Quantitative analysis of colony formation in soft agar. Statistical significance was calculated with Student’s t-test (shown is mean±s.d., n=3, ***P<0.001). (c) Representative microscopic images of glioma spheroids on day 1, day 2, day 4 and day 6. (d) Quantification of spheroid area revealed that ATF4OE cells migrate faster than control cells, but significantly slower in ATF4KD cells. Statistical significance was calculated with Student’s t-test (shown is mean±s.d., n=6, *P<0.05; **P<0.01; ***P<0.001).
Figure 4
Figure 4
ATF4 promotes glioma cell proliferation and glutamate secretion through xCT regulation. (a) xCT mRNA in human glioblastoma (WHO° II, n=12; WHO° IV, n=15) and normal brain (con, n=3) samples was evaluated by RT-PCR. ***P<0.001, Student’s t-test. (b) RT-PCR analysis of xCT mRNA levels in ATF4OE and ATF4KD glioma cells. Statistical significance was calculated with Student’s t-test (given is mean±s.d., n=3, *P<0.05; **P<0.01; ***P<0.001). (c) Immunoblot analysis of xCT, ATF4 and GAPDH (served as a loading control) in U87 and U251 cells. (d) Stable transfected ATF4OE and ATF4KD U87 cells were cultured in glutamate-free medium for 12 h, after which the culture supernatants were assayed for glutamate and cystine by HPLC. Statistical significance was calculated with Student’s t-test (shown is mean±s.d., n=3, ***P<0.001). (e) Glioma cells were co-transfected with ATF4-overexpressing plasmid plus xCT shRNA or ATF4 shRNA plus xCT-overexpressing constructs. Cell survival was determined by MTT assay. Statistical significance was calculated with Student’s t-test (shown is mean±s.d., n=8, *P<0.05; **P<0.01; ***P<0.001). (f) ATF4OE cells were treated with xCT blocker S-4-carboxy-phenylglycine (S4CPG) and sulfasalazine (SAS). Cell survival was determined by MTT assay. Statistical significance was calculated with Student’s t-test (shown is mean±s.d., n=8, *P<0.05; **P<0.01; ***P<0.001; n.s., no significance).
Figure 5
Figure 5
ATF4 overexpression renders gliomas resistant to sorafenib and erastin. (a) ATF4OE, ATF4KD and Control U87 cells were treated with sorafenib wat a concentration of 2.5 μM, 5 μM and 10 μM for 3 days. PI staining (white dots) shows the amount of dead cells. Scale bar represents 200 μm. (b) Cell survival was measured by MTT in U87 and U251 cells. Sorafenib treatment resulted in a dose-dependent inhibition of cell viability. ATF4KD glioma cells were more sensitive to sorafenib. Statistical significance was calculated with Student’s t-test (shown is mean±s.d., n=8, *P<0.05; **P<0.01; ***P<0.001). (c) ATF4OE, ATF4KD and control U87 cells were treated with 1, 2 and 5 μM erastin for 3 days. PI staining displys the amount of dead cells at the time of the MTT assay. Scale bar represents 200 μm. (d) Quantification of cell viability measured by MTT in U87 and U251 cells. ATF4OE glioma cells were resistant to erastin. Statistical significance was calculated with Student’s t-test (shown is mean±s.d., n=8, *P<0.05; **P<0.01; ***P<0.001). (e, f) Treatment of ATF4OE, ATF4KD and control U87 cells with 10 μM sorafenib and 5 μM erastin for 72 h. Cell death was determined by flow cytometry using 7-AAD and Annexin V. Statistical significance was calculated with Student’s t-test (shown is mean±s.d., n=3, *P<0.05; **P<0.01; ***P<0.001; n.s., no significance).
Figure 6
Figure 6
ATF4 knockdown renders cells susceptible for ferroptosis and lipid ROS accumulation. (a) Representative images of ATF4OE and ATF4KD U87 cells treated with 10 μM sorafenib (S) with or without deferoxamine (DFO, 100 μM) or ± ferrostatin-1 (Fer-1, 0.5 μM) for 18 h. Morphological changes were observed, including cell rounding and shrinkage. Scale bar represents 100 μm. (b) Cell survival was measured by MTT in U87 cells. Ferroptosis inhibitors rescued ATF4KD cell proliferation inhibited by sorafenib but not in ATF4OE cells. Statistical significance was calculated with Student’s t-test (shown is mean±s.d., n=8, ***P<0.001; n.s., no significance). (c) Lipid ROS accumulation was assessed in U87 cells treated for 18 h with sorafenib ± DFO or ± Fer-1 using C11-BODIPY. Statistical significance was calculated with Student’s t-test (shown is mean±s.d., n=3, *P<0.05; **P<0.01; ***P<0.001; n.s., no significance). (d) PI staining shows the amount of dead cells following treatment. Ferroptosis inhibitors prevented sorafenib-induced cell death. Scale bar represents 200 μm. (e) Effect of sorafenib ± DFO, ± Fer-1 on glioma (U87) cell death for 18 h as assessed by flow cytometry using 7-AAD and Annexin V. Statistical significance was calculated with Student’s t-test (shown is mean±s.d., n=3, *P<0.05; **P<0.01; ***P<0.001; n.s., no significance).
Figure 7
Figure 7
Inhibition of ferroptosis rescue erastin-induced cell death in ATF4 knockdown cells. (a) Visualization of ATF4OE and ATF4KD U87 cells treated with 10 μM erastin (E) ± DFO (100 μM) or ± Fer-1 (0.5 μM) for 18 h. Scale bar represents 100 μm. (b) Quantification of cell viability measured by MTT in U87 cells. Statistical significance was calculated with Student’s t-test (shown is mean±s.d., n=8, *P<0.05; **P<0.01; ***P<0.001; n.s., no significance). Ferroptosis inhibitors rescue erastin-induced cell death in ATF4KD Statistical significance was calculated with Student’s t-test (*P<0.05; n.s., no significance). (c) Lipid ROS production was assessed in U87 cells treated for 18 h with erastin ± DFO or ± Fer-1 by flow cytometry using C11-BODIPY. Statistical significance was calculated with Student’s t-test (n=3). (d) PI staining (white dots) reveals dead cells in erastin-treated ATF4OE and ATF4KD U87 cells. Scale bar represents 200 μm. (e) Effects of erastin ± DFO, ± Fer-1 on glioma (U87) cells assessed by flow cytometry using 7-AAD and Annexin V. Statistical significance was calculated with Student’s t-test (shown is mean±s.d., n=3, *P<0.05; **P<0.01; ***P<0.001; n.s., no significance).
Figure 8
Figure 8
RSL3-induced accumulation of lipid ROS and ferroptosis in ATF4KD cells. (a) Representative images of ATF4OE and ATF4KD U87 cells treated with 0.1 μM RSL3 (R) ± DFO (100 μM) or ± Fer-1 (0.5 μM) for 18 h. Scale bar represents 100 μm. (b) Quantification of cell viability measured by MTT in U87 cells. Statistical significance was calculated with Student’s t-test (shown is mean±s.d., n=8, *P<0.05; **P<0.01; ***P<0.001; n.s., no significance). Ferroptosis inhibitors counteracted the cell growth inhibitory effects of RSL3. Statistical significance was calculated with Student’s t-test (shown is mean±s.d., n=8, ***P<0.001). (c) Lipid ROS production in U87 cells treated with RSL3 ± DFO or ± Ferr-1 for 8 h assayed by flow cytometry using C11-BODIPY. Statistical significance was calculated with Student’s t-test (shown is mean±s.d., n=3, *P<0.05; **P<0.01; ***P<0.001; n.s., no significance).
Figure 9
Figure 9
ATF4 expression in gliomas mediates neuronal cell death. (a) Representative immunofluorescence images of organotypic brain slice culture system with implanted ATF4OE, ATF4KD and control U87 tumors. Neuronal cell death in living rain tissue was assessed by PI staining on day 5 in ex vivo. Scale bar represents 1 mm. (b) Quantification of tumor-induced neuronal cell death in surrounding healthy brain parenchyma. Statistical significance was calculated with Student’s t-test (shown is mean±s.d., n=6, *P<0.05; **P<0.01; ***P<0.001; n.s., no significance). (c) Quantification of tumor growth in organotypic brain slice on the indicated day. Statistical significance was calculated with Student’s t-test (shown is mean±s.d., n=4, *P<0.05; **P<0.01; ***P<0.001; n.s., no significance). (d) Primary rat neuronal cells were treated with supernatants from ATF4OE, ATF4KD, ATF4OE+xCTKD, ATF4KD+xCTOE and control cells (ctrl or sh-ctrl). Representative immunofluorescence images of β III-tubulin (green), GFAP (red) and Hoechst (blue) stained brain slices for detecting neurons, astrocytes and nuclei, respectively. PI staining shows the amount of dead cells after incubation with conditioned media for 24 h. Scale bar in upper panels represents 100 μm. Scale bar in lower panels represents 200 μm. (e) Quantification of cell death of primary rat neuronal cells after treatment with conditioned media from ATF4OE, ATF4KD and control cells. Statistical significance was calculated with Student’s t-test (shown is mean±s.d., n=12, *P<0.05; **P<0.01; ***P<0.001; n.s., no significance).
Figure 10
Figure 10
ATF4 expression promotes tumor angiogenesis. (a) Representative immunofluorescence images displaying tumor vessels. Laminin immunostaining (red) was facilitated for detecting vessels surrounding gliomas after 5 days in culture. Upper panel shows representative images of GFP-positive U251 cells (green) and vessels (red) in the peritumoral area. Scale bar represents 200 μm. Lower panel shows higher magnification of vessels (red) within the peritumoural area. Scale bar represents 100 μm. (b) Quantification of vessels number and vessels length in the peritumoral area. ATF4OE U87 tumors (left histogram) and ATF4OE U251 tumors (right histogram) show increased vessel numbers and vessel lengths in the peritumoral area compared to control tumors. Conversely, ATF4KD tumors reveal reduced tumor vessels in the peritumoral area. Statistical significance was calculated with Student’s t-test (shown is mean±s.d., n=12, *P<0.05; **P<0.01; ***P<0.001; n.s., no significance).
Figure 11
Figure 11
ATF4-induced tumor angiogenesis can be diminished by inducing ferroptosis. (a) Control, ATF4OE, ATF4KD U87 cells (blue, white circle delineated) were implanted in rat brain slices and afterwards treated with erastin (10 μM) and RLS3 (5 μM) ± Fer-1 (0.5 μM) for 5 days. Erastin and RSL3 inhibited angiogenesis in control and ATF4KD gliomas and this effects could be reversed by Fer-1. Vessels were stained for laminin (red) and nuclei were stained by Hoechst (blue). Scale bar represents 100 μm. (b) Quantitative analysis of vessel numbers and vessels lengths in peritumoral area. The data are presented as mean±s.d. with n=3 and P-values set as: *P<0.05; **P<0.01; ***P<0.001; n.s. no significance.

References

    1. Mao XY, Tokay T, Zhou HH, Jin WL. Long-range and short-range tumor-stroma networks synergistically contribute to tumor-associated epilepsy. Oncotarget 2016; 7: 33451–33460. - PMC - PubMed
    1. Eyupoglu IY, Buchfelder M, Savaskan NE. Surgical resection of malignant gliomas-role in optimizing patient outcome. Nat Rev Neurol 2013; 9: 141–151. - PubMed
    1. Chevet E, Hetz C, Samali A. Endoplasmic reticulum stress-activated cell reprogramming in oncogenesis. Cancer Discov 2015; 5: 586–597. - PubMed
    1. McConkey DJ. The integrated stress response and proteotoxicity in cancer therapy. Biochem Biophys Res Commun 2017; 482: 450–453. - PMC - PubMed
    1. Pakos-Zebrucka K, Koryga I, Mnich K, Ljujic M, Samali A, Gorman AM. The integrated stress response. EMBO Rep 2016; 17: 1374–1395. - PMC - PubMed

MeSH terms