. 2017 Jun 21;37(25):6031-6042.
doi: 10.1523/JNEUROSCI.2304-16.2017. Epub 2017 May 29.

Development of Glutamatergic Proteins in Human Visual Cortex across the Lifespan

Affiliations

Development of Glutamatergic Proteins in Human Visual Cortex across the Lifespan

Caitlin R Siu et al. J Neurosci. .

Abstract

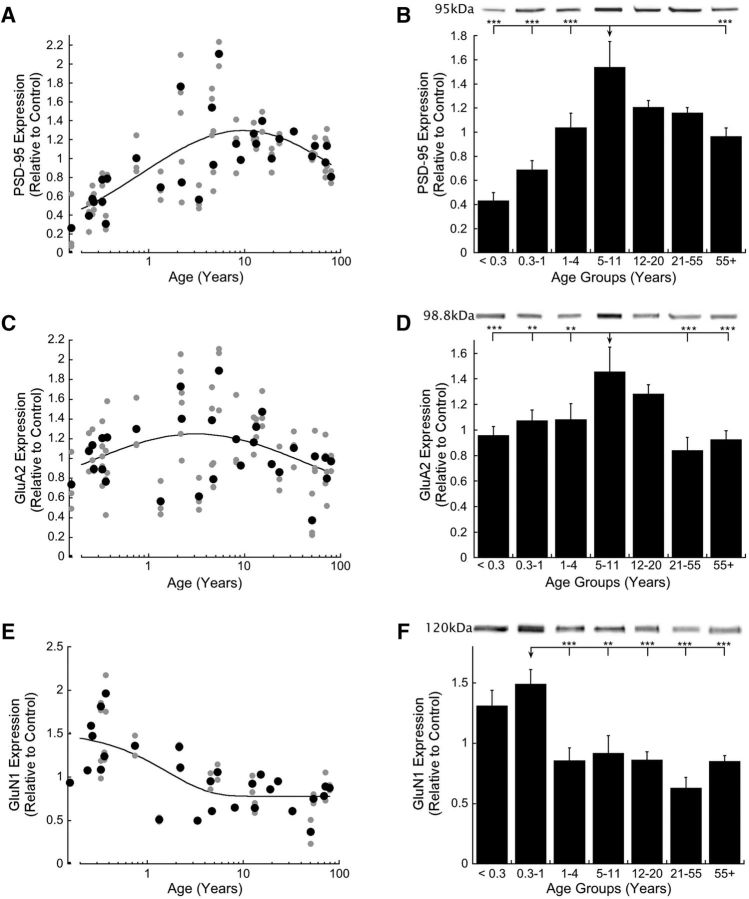
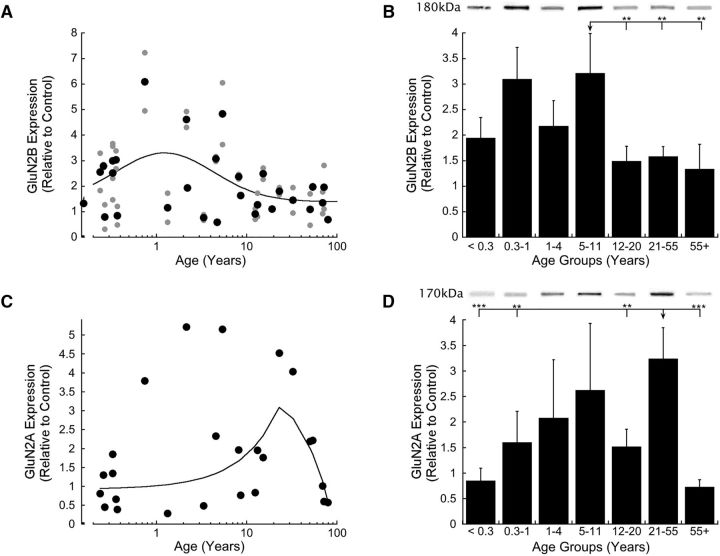
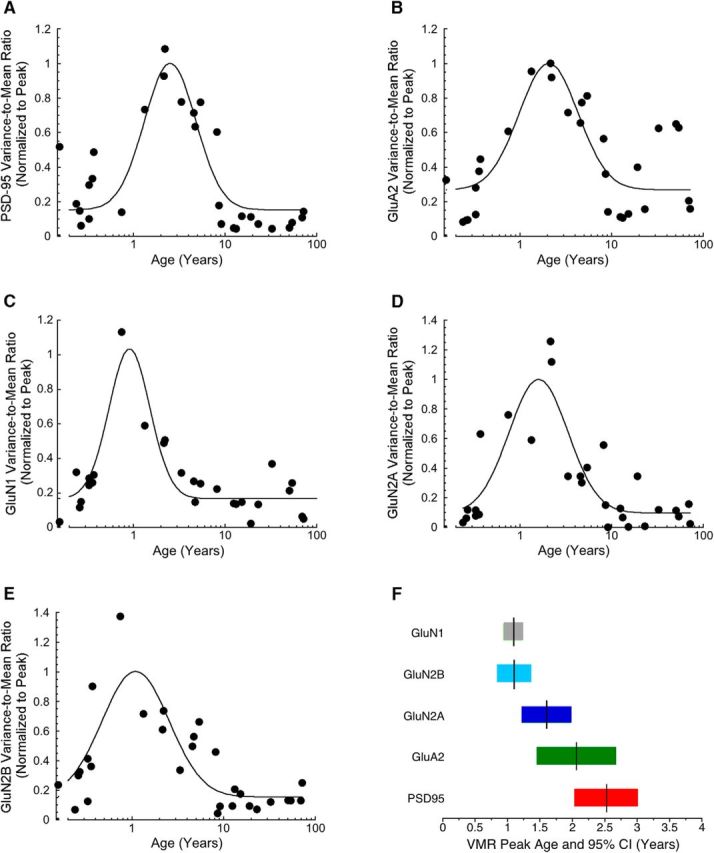
Traditionally, human primary visual cortex (V1) has been thought to mature within the first few years of life, based on anatomical studies of synapse formation, and establishment of intracortical and intercortical connections. Human vision, however, develops well beyond the first few years. Previously, we found prolonged development of some GABAergic proteins in human V1 (Pinto et al., 2010). Yet as >80% of synapses in V1 are excitatory, it remains unanswered whether the majority of synapses regulating experience-dependent plasticity and receptive field properties develop late, like their inhibitory counterparts. To address this question, we used Western blotting of postmortem tissue from human V1 (12 female, 18 male) covering a range of ages. Then we quantified a set of postsynaptic glutamatergic proteins (PSD-95, GluA2, GluN1, GluN2A, GluN2B), calculated indices for functional pairs that are developmentally regulated (GluA2:GluN1; GluN2A:GluN2B), and determined interindividual variability. We found early loss of GluN1, prolonged development of PSD-95 and GluA2 into late childhood, protracted development of GluN2A until ∼40 years, and dramatic loss of GluN2A in aging. The GluA2:GluN1 index switched at ∼1 year, but the GluN2A:GluN2B index continued to shift until ∼40 year before changing back to GluN2B in aging. We also identified young childhood as a stage of heightened interindividual variability. The changes show that human V1 develops gradually through a series of five orchestrated stages, making it likely that V1 participates in visual development and plasticity across the lifespan.SIGNIFICANCE STATEMENT Anatomical structure of human V1 appears to mature early, but vision changes across the lifespan. This discrepancy has fostered two hypotheses: either other aspects of V1 continue changing, or later changes in visual perception depend on extrastriate areas. Previously, we showed that some GABAergic synaptic proteins change across the lifespan, but most synapses in V1 are excitatory leaving unanswered how they change. So we studied expression of glutamatergic proteins in human V1 to determine their development. Here we report prolonged maturation of glutamatergic proteins, with five stages that map onto life-long changes in human visual perception. Thus, the apparent discrepancy between development of structure and function may be explained by life-long synaptic changes in human V1.

Keywords: development; glutamate; human; receptors; synaptic proteins; visual cortex.


Figures

Figure 1.
Figure 1.
Development of PSD-95, GluA2, and GluN1 expression in human V1. A, Scatterplot of PSD-95 expression across the lifespan fit with a Gaussian function (R2 = 0.457, p < 0.0001) with peak expression at 9.6 years (±4.1 years). B, Age-binned results for PSD-95 expression. C, Scatterplot of GluA2 expression across the lifespan fit with a Gaussian function (R2 = 0.131, p < 0.01), with peak expression at 3.1 years (±1.8 years). D, Age-binned results for GluA2 expression. E, Scatterplot of GluN1 expression across the lifespan fit with an exponential decay function (R2 = 0.482, p < 0.0001) and fell to mature levels (3 τ) at 4.2 years (±1.7 years). F, Age-binned results for GluN1 expression. For the scatterplots, gray dots represent each run and black dots represent the average for each case; age was plotted on a logarithmic scale. For the histograms, protein expression was binned into age groups (<0.3 years, Neonates; 0.3–1 year, Infants; 1–4 years, Young Children; 5–11 years, Older Children; 12–20 years, Teens; 21–55 years, Young Adults; >55 years, Older Adults), showing the mean and SEM. Representative bands are shown above each age group. **p < 0.01. ***p < 0.001.
Figure 2.
Figure 2.
Development of the AMPA:NMDA balance ((GluA2 − GluN1)/(GluA2 + GluN1)) in human V1. A, Scatterplot of the AMPA:NMDA balance across the lifespan fit with a quadratic function (R2 = 0.406, p < 0.0001), which peaked at 10.7 years (95% CI, 4.8–23.7 years). B, Age-binned results for the AMPA:NMDA balance. Scatterplot, histogram, and significance levels plotted using the conventions described in Figure 1. ***p < 0.001.
Figure 3.
Figure 3.
Development of GluN2B and GluN2A in human V1. A, Scatterplot of GluN2B expression across the lifespan fit with a Gaussian function (R2 = 0.176, p < 0.01), with peak expression at 1.2 years (±0.7 years). B, Age-binned results for GluN2B expression. C, Scatterplot of GluN2A expression across the lifespan fit with a weighted curve. D, Age-binned results for GluN2A expression. Scatterplots, histograms, and significance levels plotted using the conventions described in Figure 1. **p < 0.01. ***p < 0.001.
Figure 4.
Figure 4.
Development of GluN2B and GluN2A normalized to GluN1 in human V1. A, Scatterplot of GluN2B expression normalized to GluN1 across the lifespan fit with a Gaussian function (R2 = 0.106, p < 0.05), with peak expression at 3.2 years (±1.8 years). B, Age-binned results for GluN2B normalized to GluN1 expression. C, Scatterplot of GluN2A normalized to GluN1 expression across the lifespan fit with a weighted curve. D, Age-binned results for GluN2A normalized to GluN1. Scatterplots, histograms, and significance levels plotted using the conventions described in Figure 1. **p < 0.01. ***p < 0.001.
Figure 5.
Figure 5.
Development of the 2A:2B balance ((GluN2A − GluN2B)/(GluN2A + GluN2B)) in human V1. A, Scatterplot of the 2A:2B balance across the lifespan fit with a Gaussian function (R2 = 0.633, p < 0.0001), with peak expression at ∼35.9 years of age (±4.6 years). B, Age-binned results for the 2A:2B balance. Scatterplot, histogram, and significance levels plotted using the conventions described in Figure 1. **p < 0.01. ***p < 0.001.
Figure 6.
Figure 6.
Development of the VMR for PSD-95, GluA2, GluN1, GluN2A, and GluN2B in human V1. Black dots indicate the VMR for a moving window of 3 cases. Each protein's scatterplot was fit with a Gaussian function, and the data were normalized to the peak of the function. A, PSD-95 VMR peaked at 2.5 years (±0.5 years) (R2 = 0.778, p < 0.0001). B, GluA2 VMR peaked at 2.1 years (±0.6 years) (R2 = 0.641, p < 0.0001). C, GluN1 VMR peaked at 1.1 years (±0.2 years) (R2 = 0.8, p < 0.0001). D, GluN2A VMR peaked at 1.6 years (±0.4 years) (R2 = 0.694, p < 0.0001). E, GluN2B VMR peaked at 1.1 years (±0.3 years) (R2 = 0.618, p < 0.0001). F, Summary chart showing the progression of peaks of interindividual variability (vertical black line) and the 95% CI (colored bar) for each protein.
Figure 7.
Figure 7.
Summary of the five stages of development for the glutamatergic proteins. Changes for the individual glutamatergic proteins are illustrated with gray levels where black represents the maximum expression and lighter gray represents less expression. GluN1 peaked during the first year (Stage 1), GluN2B, GluA2, and PSD-95 in late childhood (Stage 3), and GluN2A at ∼40 years (Stage 4) before declining in aging (Stage 5). Changes for the two indices (2A:2B, GluA2:GluN1) are color-coded. For the 2A:2B balance, red represents more GluN2B and green represents more GluN2A. For the AMPA:NMDA balance, red represents more GluN1 and green represents more GluA2. The shift to more GluN2A peaked in adulthood (Stage 4) and then returned to more GluN2B in aging (Stage 5). The switch to more GluA2 happened at ∼1 year and continued until late childhood (Stage 3). The waves of interindividual variability for each protein are present, with dark blue representing maximum variability that occurred in young childhood (Stage 2) and lighter blue representing stages with low variability.

Similar articles

Cited by

References

    1. Banerjee A, Larsen RS, Philpot BD, Paulsen O (2016) Roles of presynaptic NMDA receptors in neurotransmission and plasticity. Trends Neurosci 39:26–39. 10.1016/j.tins.2015.11.001 - DOI - PMC - PubMed
    1. Beaulieu C, Kisvarday Z, Somogyi P, Cynader M, Cowey A (1992) Quantitative distribution of GABA-immunopositive and -immunonegative neurons and synapses in the monkey striate cortex (area 17). Cereb Cortex 2:295–309. 10.1093/cercor/2.4.295 - DOI - PubMed
    1. Bennett PJ, Sekuler R, Sekuler AB (2007) The effects of aging on motion detection and direction identification. Vision Res 47:799–809. 10.1016/j.visres.2007.01.001 - DOI - PubMed
    1. Beston BR, Jones DG, Murphy KM (2010) Experience-dependent changes in excitatory and inhibitory receptor subunit expression in visual cortex. Front Synaptic Neurosci 2:138. 10.1016/j.visres.2015.01.021 - DOI - PMC - PubMed
    1. Betts LR, Sekuler AB, Bennett PJ (2007) The effects of aging on orientation discrimination. Vision Res 47:1769–1780. 10.1016/j.visres.2007.02.016 - DOI - PubMed

Publication types

MeSH terms

LinkOut - more resources