

MSTO1 is a cytoplasmic pro-mitochondrial fusion protein, whose mutation induces myopathy and ataxia in humans
- PMID: 28554942
- PMCID: PMC5494519
- DOI: 10.15252/emmm.201607058
MSTO1 is a cytoplasmic pro-mitochondrial fusion protein, whose mutation induces myopathy and ataxia in humans
Erratum in
-
MSTO1 is a cytoplasmic pro-mitochondrial fusion protein, whose mutation induces myopathy and ataxia in humans.EMBO Mol Med. 2023 Aug 7;15(8):e17911. doi: 10.15252/emmm.202317911. Epub 2023 Jul 11. EMBO Mol Med. 2023. PMID: 37431817 Free PMC article.
Abstract
The protein MSTO1 has been localized to mitochondria and linked to mitochondrial morphology, but its specific role has remained unclear. We identified a c.22G > A (p.Val8Met) mutation of MSTO1 in patients with minor physical abnormalities, myopathy, ataxia, and neurodevelopmental impairments. Lactate stress test and myopathological results suggest mitochondrial dysfunction. In patient fibroblasts, MSTO1 mRNA and protein abundance are decreased, mitochondria display fragmentation, aggregation, and decreased network continuity and fusion activity. These characteristics can be reversed by genetic rescue. Short-term silencing of MSTO1 in HeLa cells reproduced the impairment of mitochondrial morphology and dynamics observed in the fibroblasts without damaging bioenergetics. At variance with a previous report, we find MSTO1 to be localized in the cytoplasmic area with limited colocalization with mitochondria. MSTO1 interacts with the fusion machinery as a soluble factor at the cytoplasm-mitochondrial outer membrane interface. After plasma membrane permeabilization, MSTO1 is released from the cells. Thus, an MSTO1 loss-of-function mutation is associated with a human disorder showing mitochondrial involvement. MSTO1 likely has a physiologically relevant role in mitochondrial morphogenesis by supporting mitochondrial fusion.
Keywords: MSTO1; misato; mitochondria; mitochondrial disease; mitochondrial fusion.
© 2017 The Authors. Published under the terms of the CC BY 4.0 license.
Figures

Family tree of the investigated patients. Arrow indicates the proband.
Electron microscopy sections of the patient muscle biopsy specimen. Increased number of mitochondria both subsarcolemmal and intermyofibrillar, lipid droplets, and glycogen accumulation (electron microscopy, 30,000×).
Sequenogram of the suspected pathogenic mutation and the neighboring polymorphism in exon 1 of MSTO1 gene from genomic (upper part) and cDNA (lower part). Arrow indicates the position of the mutation.
Taxonomical alignments of the affected MSTO1 protein sequence. Location of the alterations in the patients are shown in bold. The red “M” indicates the amino acid substitution segregated in all affected family members.
Normalized mRNA expression level from the patient primary fibroblasts (percentage of the average value of the healthy controls) (mean ± SEM).
MSTO1 Western blotting of the patient and control fibroblast. Left: representative blots; right: normalized protein abundance of the percentage of the average protein expression levels of the controls (mean ± SEM).
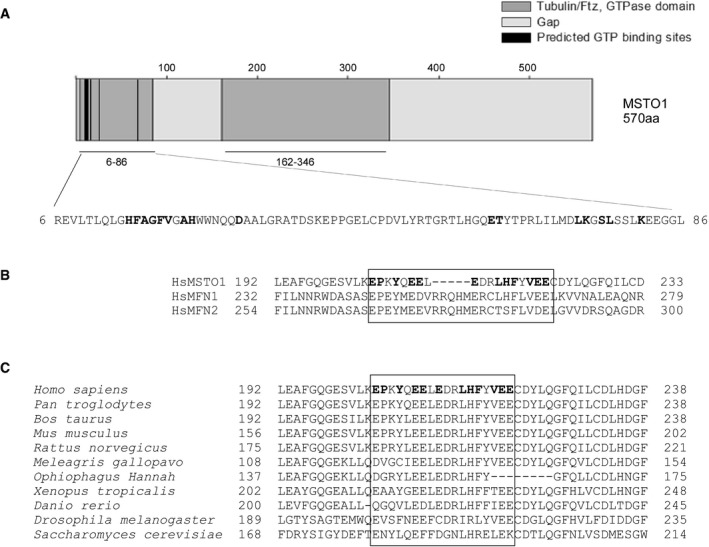
Predicted GTP binding and GTPase homology domains in MSTO1. The bold font indicates the possible GTPase binding sites.
Alignment of MSTO1 with the GTPase domain of MFNs. The bold fonts and box indicates the higher similarities.
Evolutionary conservation of the region in MSTO1, which shows similarity the GTPase regions of MFNs. The bold fonts and box indicates the higher similarities.
- A
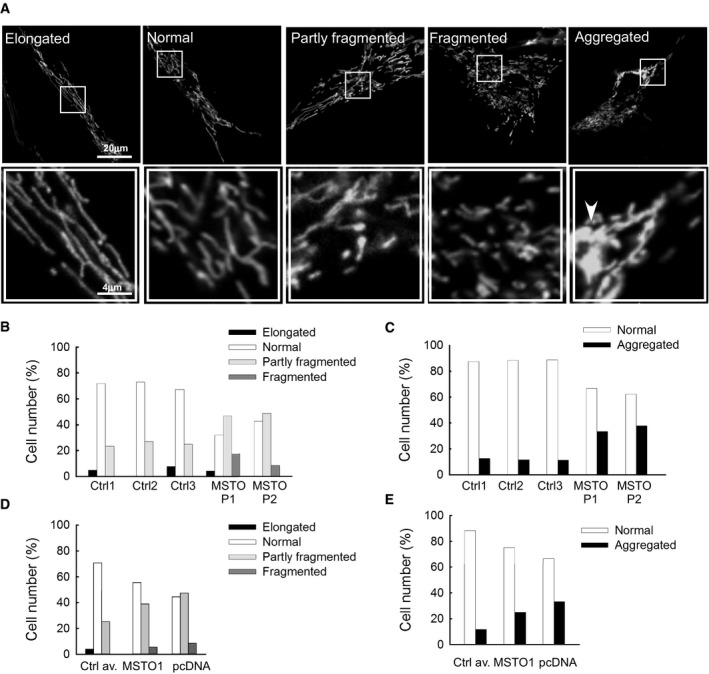
Representative figures of the different mitochondrial types. The arrowhead indicates the aggregated mitochondria. The white box showing higher magnifications.
- B, C
Distribution of the different type of mitochondria in primary fibroblasts.
- D, E
Distribution of the different type of mitochondria after MSTO1 silencing in HeLa cells (Scr.: scramble siRNA‐silenced cells; MSTO1: MSTO1 siRNA‐silenced cells).

Image time series showing a representative fibroblast cell before and after 2P photoactivation of mtPA‐GFP (white squares): 0 s (pre‐activation), 24 s (immediately after photoactivation), 40 s, and 500 s.
The time course of the ratio of F mtPA‐GFP to F mtDsRed for the region of photoactivation (RPA) (left); the decay of the fluorescence ratio in the RPA at 500 s (right) (number of imaged cells: Ctrl1 N = 94; Ctrl2 N = 45; Ctrl3 N = 87; MSTO P1 N = 84; MSTO P2 N = 130 from minimum three experiments per each cells). Stars indicate the significant differences (Student's t‐test: Ctrl average vs. MSTO P1 *P = 1.44 × 10⁻⁹, Ctrl average vs. MSTO P2 *P = 1.52 × 10⁻¹²; one‐way ANOVA: P = 0.00815) (mean ± SEM).

Representative example is shown out of 2,200 events. During photoactivation of mtPA‐GFP, mtDsRed is photobleached, allowing detection of the mixing of each fluorescent protein after mitochondrial fusion. Mitochondria shown in the white box undergo an end‐to‐end fusion event at 272 s. During the event, mitochondrion #1 donates fluorescent mtPA‐GFP to mitochondrion #2 (acceptor). At the same time, the green acceptor mitochondrion donates fluorescent mtDsRed to mitochondrion #1. Arrows show the location of the fusion, abrupt, and complementary inter‐mitochondrial transfer of the fluorescent proteins. The graphs on the right show the average mtDsRed1 and mtPA‐GFP fluorescence intensities of mitochondrion 1 and mitochondrion 2 before and after fusion event. The white box indicates two mitochondria before and after fusion.
Rates of fusion events in primary fibroblasts. Stars indicate the significant differences (Student's t‐test: Ctrl average vs. MSTO P1 *P = 9.6 × 10⁻²¹, Ctrl average vs. MSTO P2 *P = 5.3 × 10⁻³¹; one‐way ANOVA: P < 0.00001) (mean ± SEM).
Average duration of fusion events which were followed by fission during the 8‐min recording time (mean ± SEM).
Distribution of transient and complete type fusion events.
Orientation characteristics of fusion events in different fibroblasts (mean ± SEM).
Western blot of the main fusion and fission proteins. Left: representative blots; right: quantified protein abundances in MSTO cells relative to the control cell average (mean ± SEM).

Representative Western blot of MSTO1 protein expression after mtDsRed1‐T2A‐MSTO1 vector delivery (representative of three experiments).
Image time series showing representative pcDNA‐ and mtDsRed1‐T2A‐MSTO1‐transfected fibroblast cell before and after 2P photoactivation of mtPA‐GFP (white squares) as in Fig 2A.
The time course of the ratio of F mtPA‐GFP to F mtDsRed for the region of photoactivation (RPA) (left); the decay of the fluorescence ratio in the RPA at 500 s (right). Stars indicate the significant differences (Student's t‐test: *P = 0.00412, ANOVA: P = 0.00859) (mean ± SEM).
Rates of fusion events in primary fibroblasts. Stars indicate the significant differences (Student's t‐test: *P = 1.71 × 10⁻⁴, ANOVA: P = 0.00343) (mean ± SEM).
Average duration of fusion events which were followed by fission during the 8‐min recording time (mean ± SEM).
Distribution of transient and complete type fusion events.
Orientation characteristics of fusion events in different fibroblasts (mean ± SEM).

Protein expression of MSTO1 and the main fusion and fission proteins after MSTO1 silencing. Top: representative blots; bottom: normalized protein abundance of the percentage of the average protein expression levels of the scramble siRNA‐treated cells (N = 3) (mean ± SEM).
Image time series showing a representative MSTO1‐ and scramble siRNA‐silenced HeLa cell before and after 2P photoactivation of mtPA‐GFP (white squares) as in Fig 2A.
The time course of the ratio of F mtPA‐GFP to F mtDsRed for the region of photoactivation (RPA) (left); the decay of the fluorescence ratio in the RPA at 500 s (right). Stars indicate the significant differences (Student's t‐test: *P = 5.4 × 10⁻⁴, one‐way ANOVA: P = 0.03678) (mean ± SEM).
Rates of fusion events in silenced HeLa cells. Stars indicate the significant differences (Student's t‐test: *P = 7.15 × 10⁻¹⁹, one‐way ANOVA: P < 0.00001) (mean ± SEM).
Average duration of fusion events which were followed by fission during the 8‐min recording time. Stars indicate the significant differences (Student's t‐test: *P = 3.67 × 10⁻⁴, one‐way ANOVA: P = 0.00052) (mean ± SEM).
Distribution of transient and complete type fusion events.
Orientation characteristics of fusion events in silenced and control HeLa cells (mean ± SEM).


ΔΨm measured using TMRE in suspensions of permeabilized HeLa cells. Increase in fluorescence after each CaCl2 pulse indicates depolarization. Left inset shows resting ΔΨm as initial TMRE fluorescence normalized to the fluorescence attained after complete depolarization by uncoupler (5 μM FCCP). Left graphs shows the ΔΨm loss evoked by Ca2+ pulses (4 and 3 pairs of scrambled and MSTO siRNA‐silenced cells per measurement from two independent experiments). Arrows indicate the CaCl2 additions (20 μM each) (mean ± SEM).
Clearance of Ca2+ by mitochondria. The cells were challenged by repetitive CaCl2 pulses (20 μM each). Ca2+ uptake is shown in the representative traces by the decay of the [Ca2+] increases evoked by each CaCl2 addition (arrows). Left inset shows the mean resting “cytoplasmic” Ca2+ concentrations, the left graph shows mitochondrial Ca2+ uptake after each Ca2+ pulse (4 and 3 pairs of scrambled and MSTO siRNA‐silenced cells per measurement from two independent experiments) (mean ± SEM).
JO2 was measured using the Seahorse XF24 analyzer and calculated by subtracting the O2 consumption rates measured prior to injecting the complex III inhibitor antimycin A (1 μM) from the rate measured after antimycin addition. Basal JO2 refers to the JO2 in cells exposed only to DMEM + substrates. Maximal JO2 refers to the JO2 after injecting the chemical uncoupler FCCP (250 nM). P‐value was calculated using Student's t‐test (P = 0.01). n = 5 different passages per siRNA treatment (mean ± SEM).

Representative Western blot of MSTO1 protein expression after both MSTO1‐Myc and mtDsRed1‐T2A‐MSTO1 gene delivery compared to the pcDNA‐transfected cell lysate.
Subcellular distribution of MSTO1, immunofluorescence visualization was performed with anti‐MSTO1 antibody in HeLa cells, which were transfected with mtDsRed1‐T2A‐MSTO1 vector 24 h before fixation.
Localization of MSTO1 protein after 24‐h cotransfection with an OMM‐targeted GFP (OMP25‐GFP) and MSTO‐cMyc vectors. The intact (upper part) and permeabilized (lower part) cells were immunostained with anti‐MSTO1 or anti‐cMyc antibodies.
Percentage of MSTO1 colocalization with the mitochondria in intact cells (imaged cells N = 30) (mean ± SEM).
Percentage of MSTO1 colocalization with the mitochondria in permeabilized cells (imaged cells N = 30) (mean ± SEM).
Comparative Western blotting of the MSTO1 expression in total cell lysate and isolated mitochondria fraction in HeLa cells.

Representative Western blots of MSTO1, hexokinase II, α‐tubulin, and cytochrome c in membrane and supernatant fractions of MSTO1‐cMyc‐transfected and non‐transfected cells.
Protein release of MSTO1, hexokinase II, α‐tubulin after plasma membrane permeabilization (values are normalized to the intact cells). N = 3 (mean ± SEM).
References
-
- Chan DC (2006) Mitochondria: dynamic organelles in disease, aging, and development. Cell 125: 1241–1252 - PubMed
-
- Chiara F, Castellaro D, Marin O, Petronilli V, Brusilow WS, Juhaszova M, Sollott SJ, Forte M, Bernardi P, Rasola A (2008) Hexokinase II detachment from mitochondria triggers apoptosis through the permeability transition pore independent of voltage‐dependent anion channels. PLoS ONE 3: e1852 - PMC - PubMed
Publication types
MeSH terms
Substances
Grants and funding
LinkOut - more resources
Full Text Sources
Other Literature Sources
Medical
Molecular Biology Databases
