. 2017 May;5(10):e13287.
doi: 10.14814/phy2.13287.

Fetuin-A aggravates lipotoxicity in podocytes via interleukin-1 signaling

Affiliations

Fetuin-A aggravates lipotoxicity in podocytes via interleukin-1 signaling

Jana M Orellana et al. Physiol Rep. 2017 May.

Abstract

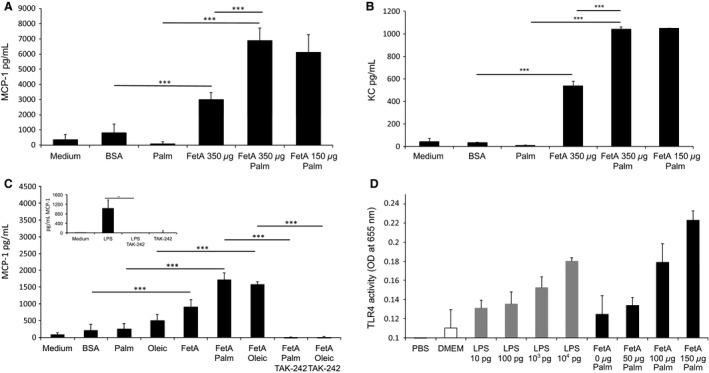
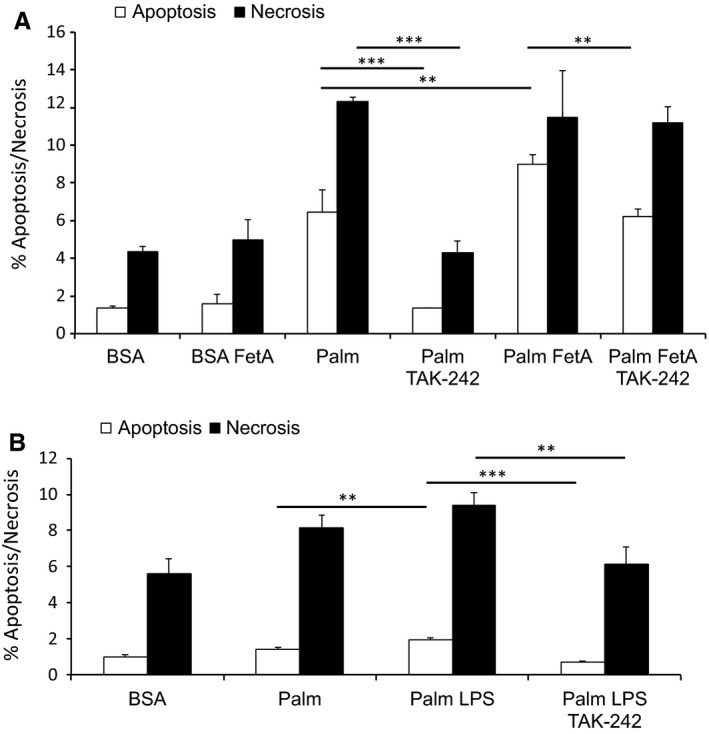
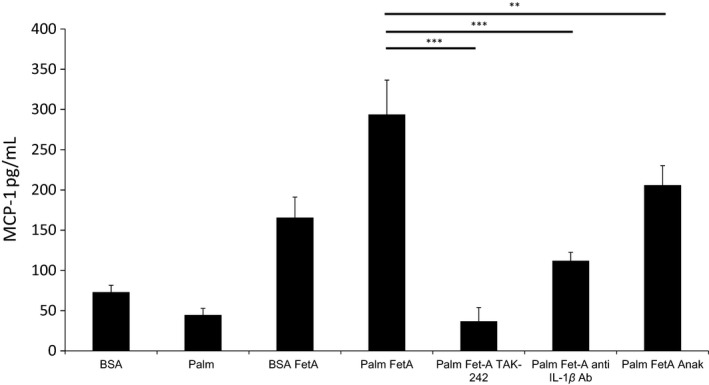
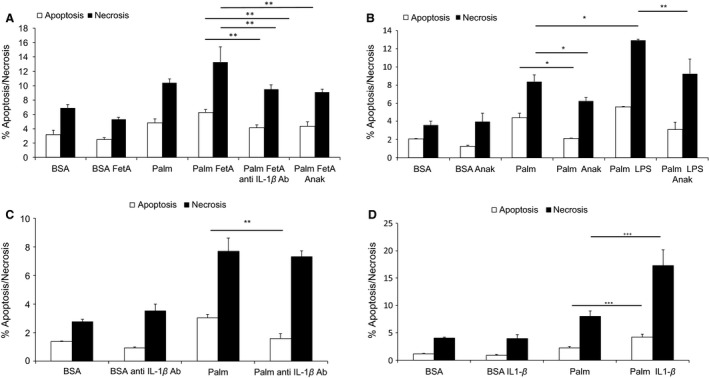
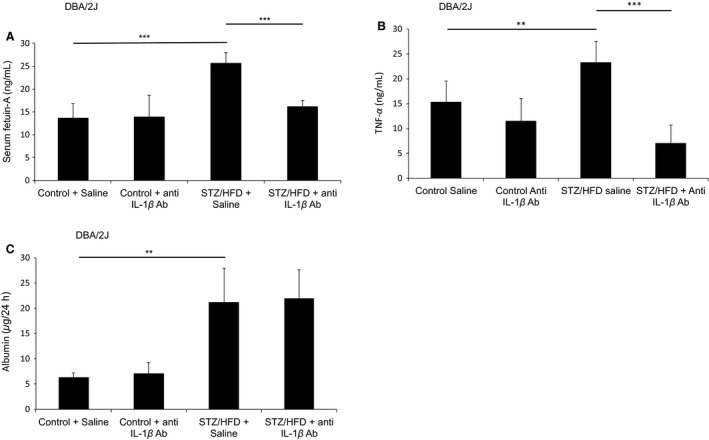
Sterile inflammation is considered critical in the pathogenesis of diabetic nephropathy (DN). Here we show that Fetuin-A (FetA) or lipopolysaccharide (LPS) exacerbate palmitic acid-induced podocyte death, which is associated with a strong induction of monocyte chemoattractant protein-1 (MCP-1) and keratinocyte chemoattractant (KC). Moreover, blockage of TLR4 prevents MCP-1 and KC secretion and attenuates podocyte death induced by palmitic acid alone or combined with FetA. In addition, inhibition of interleukin-1 (IL-1) signaling by anakinra, a recombinant human IL-1Ra, or a murinized anti-IL-1β antibody attenuates the inflammatory and ultimate cell death response elicited by FetA alone or combined with palmitic acid. In vivo short-term therapy of diabetic DBA/2J mice with an anti-IL1-β antibody for 4 weeks prevented an increase in serum FetA and considerably decreased urinary tumor necrosis alpha (TNF-α), a known risk factor for DN progression. In summary, our results suggest that FetA similarly to LPS leads to an inflammatory response in podocytes, which exacerbates palmitic acid-induced podocyte death and our data imply a critical role for IL-1β signaling in this process. The study offers the rational for prolonged in vivo studies aimed at testing anti-IL-1β therapy for prevention and treatment of DN.

Keywords: Diabetic nephropathy; Fetuin‐A; free fatty acids; interleukin‐1; palmitic acid; toll‐like receptor.


Conflict of interest statement

The authors have no conflict of interests.

Figures

Figure 1
Figure 1
FetA but not palmitic acid or oleic acid stimulates MCP‐1 or KC secretion in podocyte. (A) Graph shows MCP‐1 expression after treating podocytes with 75 μmol/L palmitic acid (palm) or bovine serum albumin (BSA) (control) either with or without 150–350 μg/mL bovine FetA. Bar graph represents mean ± SD MCP‐1 levels (in pg/mL) in the supernatant after 12 h (n = 6, ***P < 0.001). (B) Graph shows KC expression after treating podocytes with 75 μmol/L palm or BSA (control) either with or without 150–350 μg/mL bovine FetA. Bar graph represents mean ± SD KC levels (in pg/mL) in the supernatant after 12 h (n = 6, ***P < 0.001). (C) Graph shows MCP‐1 expression in podocytes treated with 75 μg/mL palm or 75 μg/mL oleic acid (oleic) alone or in combination with 200 μg/mL murine FetA. Bar graph represents mean ± SD MCP‐1 levels (in pg/mL) in the supernatant after 16 h of treatment and 1 h of preincubation with TAK‐242 (n = 4, ***P < 0.001). Insert: LPS induces MCP‐1 release, and TAK‐242 prevents chemokine expression. Podocytes were treated with 5 ng/mL LPS. Bar graph represents mean ± SD MCP‐1 levels (in pg/mL) in the supernatant after 16 h of treatment and 1 h of preincubation with TAK‐242 (n = 4, **P < 0.01). (D) Graph shows TLR4 activation in HEK‐Blue™ hTLR4 cells treated with LPS (10 pg, 100 pg/mL, 103 pg/mL, 104 pg/mL) or 150 μmol/L palmitic acid in the presence of murine FetA (0 μg/mL, 50 μg/mL, 100 μg/mL, 150 μg/mL) for 18 h. Bar graph represents mean percentages ± SD of OD reading (n = 3).
Figure 2
Figure 2
TLR4 blockage attenuates bovine FetA or LPS exacerbated palmitic acid‐induced podocyte death. (A) Graph shows podocytes treated with 200 μmol/L palmitic acid (palm) or bovine serum albumin (BSA) (control) alone or in combination with 200 μg/mL bovine FetA for 48 h and preincubated with 1 ng/mL TAK‐242 for 1 h. Bar graph represents the mean percentages ± SD of Annexin V‐positive/PI‐negative (early apoptotic) and Annexin V‐positive/PI‐positive (late apoptotic/necrotic) podocytes (n = 3, **P < 0.01, ***P < 0.001). (B) Graph shows podocytes exposed to BSA (control), 200 μmol/L palm alone or combined with 5 ng/mL LPS for 48 h and with or without preincubation of 1 ng/mL TAK‐242 for 1 h. Bar graph represents the mean percentages ± SD of Annexin V‐positive/PI‐negative (early apoptotic) and Annexin V‐positive/PI‐positive (late apoptotic/necrotic) podocytes (n = 3, **P < 0.01, ***P < 0.001).
Figure 3
Figure 3
The TLR4 blocker TAK‐242 or IL‐1 neutralization prevent chemokine expression induced by bovine FetA alone or in combination with FFAs. Podocytes were treated with 75 μmol/L palm or BSA (control) alone or in combination with 200 μg/mL bovine FetA, and preincubated with 1 ng/mL TLR4 blocker (TAK‐242) or 1 μg/mL IL‐1R antagonist (anakinra) or 3.3 μg/mL anti‐IL‐1β antibody (anti‐IL‐1β Ab). Bar graphs represent mean ± SD MCP‐1 levels (in pg/mL) in the supernatant after 1 h of preincubation and treatment for 16 h (n = 3, *P < 0.05, **P < 0.01, ***P < 0.001).
Figure 4
Figure 4
Antagonization of IL‐1 attenuates FetA or LPS exacerbated palmitic acid‐induced podocyte death. (A) Graph shows podocytes treated with 200 μmol/L palmitic acid (palm) or bovine serum albumin (BSA) (control) alone or in combination with 200 μg/mL bovine FetA for 48 h, and preincubated for 1 h with 1 ng/mL TAK‐242, or 3.3 μg/mL anti‐IL‐1β antibody, or 1 μg/mL IL‐1Ra (Anakinra). Bar graph represents the mean percentages ± SD of Annexin V‐positive/PI‐negative (early apoptotic) and Annexin V‐positive/PI‐positive (late apoptotic/necrotic) podocytes (n = 3, **P < 0.01, ***P < 0.001). (B) Graph shows podocytes exposed to palm or BSA (control) alone or in combination with 1 ng/mL LPS, and preincubated for 30 min with 1 μg/mL anakinra. Podocytes were treated for 48 h. Bar graph represents the mean percentages ± SD of Annexin V‐positive/PI‐negative (early apoptotic) and Annexin V‐positive/PI‐positive (late apoptotic/necrotic) podocytes (n = 3, *P < 0.05, **P < 0.01). (C) Graph represents podocytes exposed to 200 μmol/L palm or BSA (control) alone or preincubated for 1 h with 3.3 μg/mL anti‐IL1β antibody. Podocytes were treated for 48 h. Bar graph represents the mean percentages ± SD of Annexin V‐positive/PI‐negative (early apoptotic) and Annexin V‐positive/PI‐positive (late apoptotic/necrotic) podocytes (n = 3 *P < 0.05, **P < 0.01). (D) Graph shows podocytes treated with 200 μmol/L palm or BSA (control) and 5 ng/mL IL‐1β for 48 h. Bar graph represents the mean percentages ± SD of Annexin V‐positive/PI‐negative (early apoptotic) and Annexin V‐positive/PI‐positive (late apoptotic/necrotic) podocytes (n = 3, ***P < 0.001).
Figure 5
Figure 5
Anti‐IL‐1β treatment reduces serum FetA and urinary TNFα levels in diabetic DBA/2J mice. (A) One week after the last streptozotocin (STZ) injection, DBA/2J mice were fed a HFD and control groups were maintained on chow diet for 4 weeks. Anti‐IL‐1β antibody treatment was started simultaneously as mice were fed a HFD and administered i.p. at 10 μg/g of mice for the first 2 weeks of treatment and then maintained at 5 μg/g for another 2 weeks. Bar graph represents mean (SD) of serum FetA levels (n = 6, ***P < 0.001). (B) Bar graph represents mean (SD) of urinary TNFα levels (n = 6, **P < 0.01, ***P < 0. 001). (C) Bar graph represents mean (SD) of urinary albumin values collected in 24 h (n = 6, **P < 0.01).

References

    1. Akira, S. , Takeda K., and Kaisho T.. 2001. Toll‐like receptors: critical proteins linking innate and acquired immunity. Nat. Immunol. 2:675–680. - PubMed
    1. Awad, A. S. , Kinsey G. R., Khutsishvili K., Gao T., Bolton W. K., and Okusa M. D.. 2011. Monocyte/macrophage chemokine receptor CCR2 mediates diabetic renal injury. Am. J. Physiol. Renal Physiol. 301:F1358–F1366. - PMC - PubMed
    1. Basu, S. , Bhattacharya M., Chatterjee T. K., Chaudhuri S., Todi S. K., and Majumdar A.. 2010. Microalbuminuria: a novel biomarker of sepsis. Indian J. Crit. Care Med. 14:22–28. - PMC - PubMed
    1. Blakemore, A. I. , Cox A., Gonzalez A. M., Maskil J. K., Hughes M. E., Wilson R. M., et al. 1996. Interleukin‐1 receptor antagonist allele (IL1RN*2) associated with nephropathy in diabetes mellitus. Hum. Genet. 97:369–374. - PubMed
    1. Boni‐Schnetzler, M. , Boller S., Debray S., Bouzakri K., Meier D. T., Prazak R., et al. 2009. Free fatty acids induce a proinflammatory response in islets via the abundantly expressed interleukin‐1 receptor I. Endocrinology 150:5218–5229. - PubMed

MeSH terms