. 2017 Dec;31(12):2815-2823.
doi: 10.1038/leu.2017.164. Epub 2017 May 30.

Genomic determinants of chronic myelomonocytic leukemia

Affiliations

Genomic determinants of chronic myelomonocytic leukemia

B J Patel et al. Leukemia. 2017 Dec.

Abstract

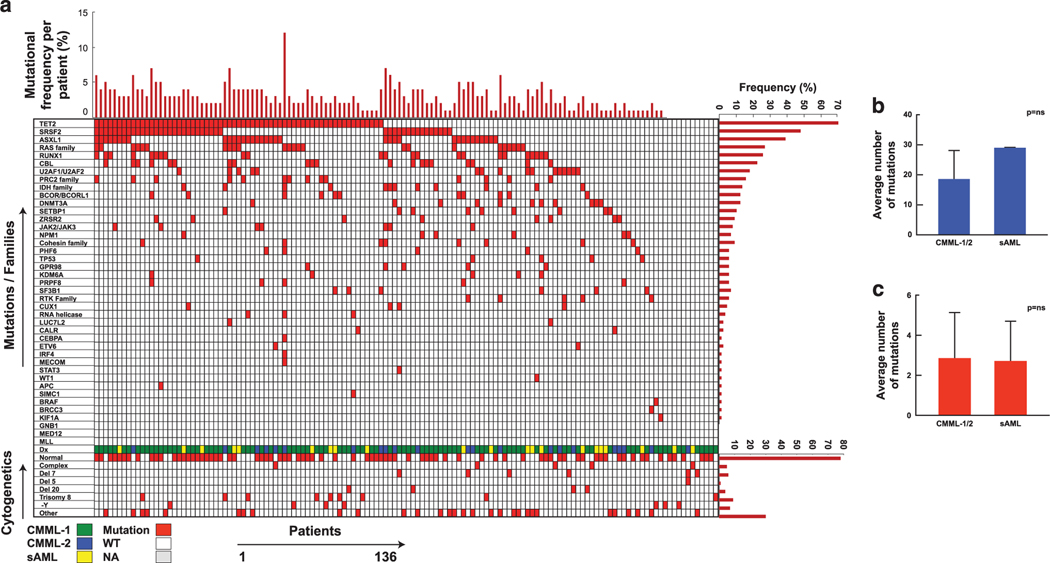
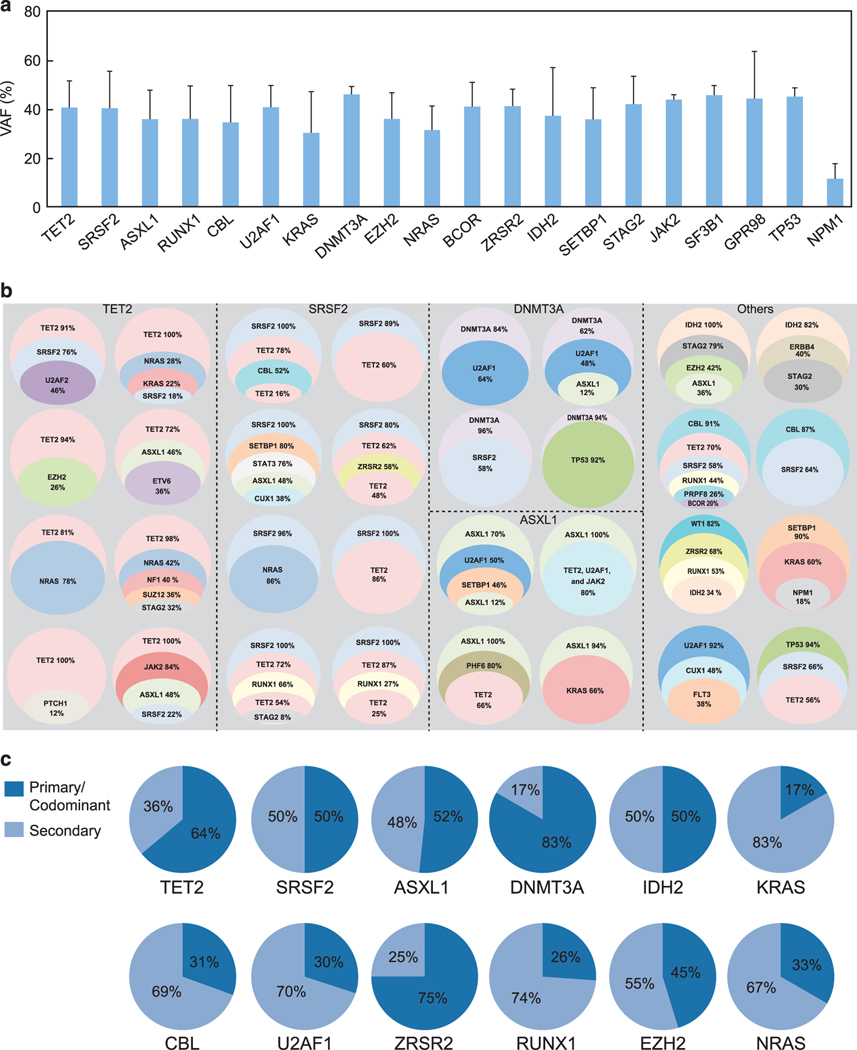
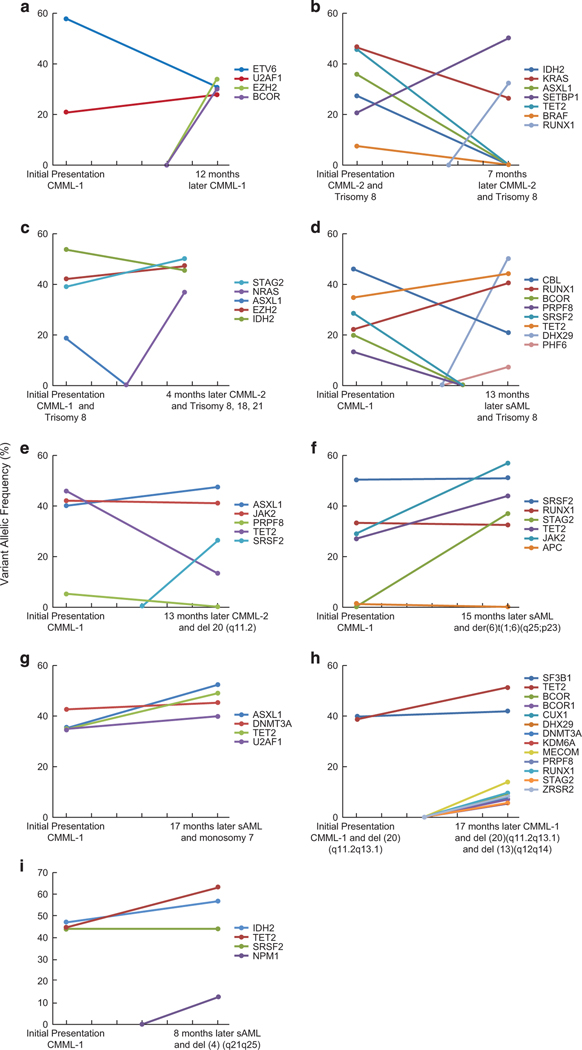
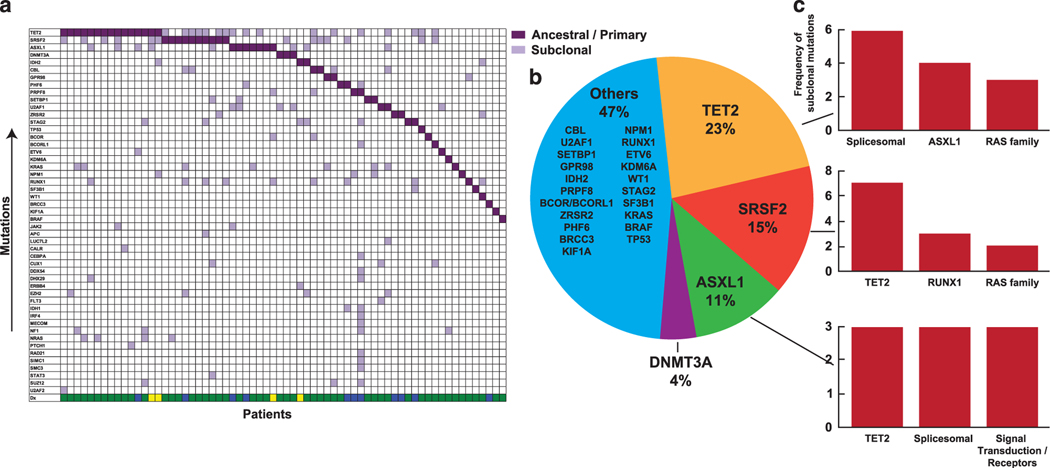
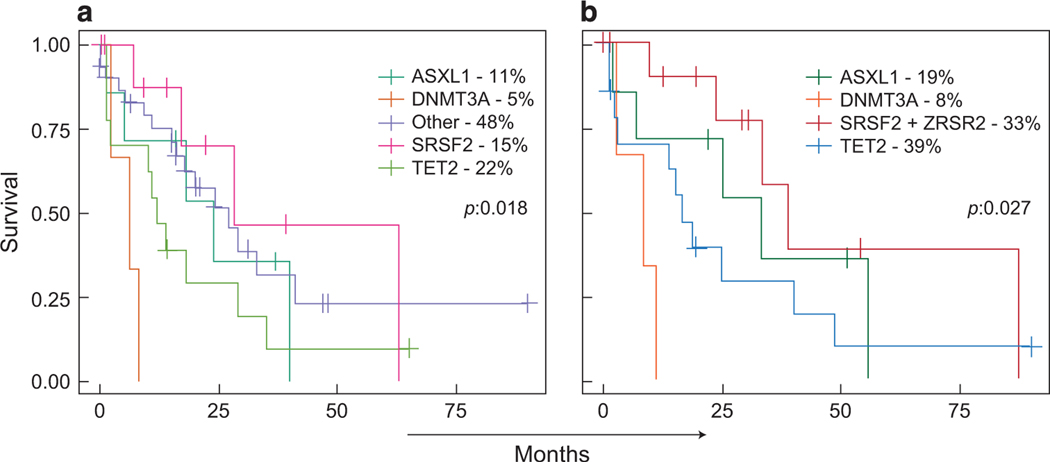
The biology, clinical phenotype and progression rate of chronic myelomonocytic leukemia (CMML) are highly variable due to diverse initiating and secondary clonal genetic events. To determine the effects of molecular features including clonal hierarchy in CMML, we studied whole-exome and targeted next-generation sequencing data from 150 patients with robust clinical and molecular annotation assessed cross-sectionally and at serial time points of disease evolution. To identify molecular lesions unique to CMML, we compared it to the related myeloid neoplasms (N=586), including juvenile myelomonocytic leukemia, myelodysplastic syndromes (MDS) and primary monocytic acute myeloid leukemia and discerned distinct molecular profiles despite similar pathomorphological features. Within CMML, mutations in certain pathways correlated with clinical classification, for example, proliferative vs dysplastic features. While most CMML patients (59%) had ancestral (dominant/co-dominant) mutations involving TET2, SRSF2 or ASXL1 genes, secondary subclonal hierarchy correlated with clinical phenotypes or outcomes. For example, progression was associated with acquisition of new expanding clones carrying biallelic TET2 mutations or RAS family, or spliceosomal gene mutations. In contrast, dysplastic features correlated with mutations usually encountered in MDS (for example, SF3B1 and U2AF1). Classification of CMML based on hierarchies of ancestral and subclonal mutational events may correlate strongly with clinical features and prognosis.


Conflict of interest statement

CONFLICT OF INTEREST

The authors declare no conflict of interest.

Figures

Figure 1.
Figure 1.
Prevalence and distribution of somatic mutations in CMML. (a) Each column represents one patient and each row corresponds to one gene or family of genes. The color of each rectangle represents the status of the gene, an associated diagnosis and karyotype for each individual patient. The bar graphs represent the frequency of mutations for each individual patients, mutations and cytogenetics. For the purpose of this presentation mutations were grouped according to functional relationships (Supplementary Table 2). (b) Average number of somatic mutations detected by whole-exome sequencing and (c) average number of mutations detected by targeted deep sequencing.
Figure 2.
Figure 2.
CPSS The bar graphs represent the frequency of the mutations for each disease type. The stairway plots depict the concordance between two mutations. (a) CMML compared to JMML. (b) sAML-post CMML compared to non-core binding factor AML M4/M5. (c) CMML-1 compared to low-risk MDS. (d) CMML-2+sAML-post-CMML sAML compared to high-risk MDS+post-MDS sAML.
Figure 3.
Figure 3.
Clonal architecture/hierarchy in CMML. (a) Mean VAF of the most frequently mutated genes in CMML. (b) Representative cases correspond to the circles grouped by first-hit/ancestral. Subclonal mutations are represented by individual colors circled areas proportional to subclonal burden. (c) For most commonly mutated genes proportion of cases with clonal vs subclonal mutations of any given gene is shown. Primary and subclonal status is determined by ranking.
Figure 4.
Figure 4.
Serial analysis in CMML. (a–i) Serial analysis of nine individuals to illustrate the clonal dynamics. Patients were analyzed at presentation, along with the VAF of numerous mutations, followed by the acquisition of new mutations, cytogenetic abnormalities and progression.
Figure 5.
Figure 5.
Ancestral and subclonal events in CMML. (a) Distribution of ancestral mutations (purple squares vs light purple squares correspond to subclonal events per patient in a vertical arrangement or for any given mutation in horizontal lines by prevalence. (b) Pie diagram shows the distribution of the most common ancestral events. (c) The bar graphs represent the most common subclonal events for the top three ancestral events in CMML.
Figure 6.
Figure 6.
The impact of ancestral events on survival in CMML. (a) Comparison of individual ancestral events. (b) Comparison between most common individual ancestral events and functional gene groups.

References

    1. Arber DA, Orazi A, Hasserjian R, Thiele J, Borowitz MJ, Le Beau MM et al. The 2016 revision to the World Health Organization classification of myeloid neoplasms and acute leukemia. Blood 2016; 127: 2391–2405. - PubMed
    1. Sakaguchi H, Okuno Y, Muramatsu H, Yoshida K, Shiraishi Y, Takahashi M et al.Exome sequencing identifies secondary mutations of SETBP1 and JAK3 in juvenile myelomonocytic leukemia. Nat Genet 2013; 45: 937–941. - PubMed
    1. Campo E, Swerdlow SH, Harris NL, Pileri S, Stein H, Jaffe ES. The 2008 WHO classification of lymphoid neoplasms and beyond: evolving concepts and practical applications. Blood 2011; 117: 5019–5032. - PMC - PubMed
    1. Haferlach T, Nagata Y, Grossmann V, Okuno Y, Bacher U, Nagae G et al.Landscape of genetic lesions in 944 patients with myelodysplastic syndromes. Leukemia 2014; 28: 241–247. - PMC - PubMed
    1. Malcovati L, Papaemmanuil E, Ambaglio I, Elena C, Gallì A, Della Porta MG et al.Driver somatic mutations identify distinct disease entities within myeloid neoplasms with myelodysplasia. Blood 2014; 124: 1513–1521. - PMC - PubMed

Publication types

MeSH terms