An official website of the United States government
The .gov means it’s official.
Federal government websites often end in .gov or .mil. Before
sharing sensitive information, make sure you’re on a federal
government site.
The site is secure.
The https:// ensures that you are connecting to the
official website and that any information you provide is encrypted
and transmitted securely.
We show that financial knowledge is a key determinant of wealth inequality in a stochastic lifecycle model with endogenous financial knowledge accumulation, where financial knowledge enables individuals to better allocate lifetime resources in a world of uncertainty and imperfect insurance. Moreover, because of how the U.S. social insurance system works, better-educated individuals have most to gain from investing in financial knowledge. Our parsimonious specification generates substantial wealth inequality relative to a one-asset saving model and one where returns on wealth depend on portfolio composition alone. We estimate that 30-40 percent of retirement wealth inequality is accounted for by financial knowledge.
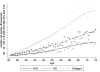
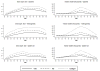
Figure 1. Life Cycle Net Household Income Profiles by Educational Attainment
This figure shows median…
Figure 1. Life Cycle Net Household Income Profiles by Educational Attainment
This figure shows median net household income by education group computed from the PSID for waves 1984–2005 (in $2004; see text). The term
Figure 2. Life Cycle Wealth by Educational…
Figure 2. Life Cycle Wealth by Educational Attainment
This figure reports median wealth profiles by…
Figure 2. Life Cycle Wealth by Educational Attainment
This figure reports median wealth profiles by education group, from the PSID (in $2004; see Figure 1 and text). The profiles are predicted from median regressions with a correction for cohort effects (following French, 2005); wealth refers to the sum of assets minus debt. Wealth is predicted for all persons born 1935–1945; age profiles are smoothed using a lowess filter.
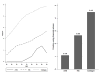
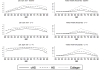
Figure 3. Observed Financial Knowledge and Use…
Figure 3. Observed Financial Knowledge and Use of Financial Advice by Age and Education
The…
Figure 3. Observed Financial Knowledge and Use of Financial Advice by Age and Education
The left panel of this figure shows the fraction of respondents in the 2012 National Financial Capability Study (NFCS) who answered all five financial knowledge questions correctly, by five-year age groups and three education levels. The right panel shows the fraction of respondents in the NFCS, by education level, who reported using a financial adviser. See also Figure 1.
Figure 4. Simulated Average Levels of and…
Figure 4. Simulated Average Levels of and Expenditures on Financial Knowledge
(FK). These figures report…
Figure 4. Simulated Average Levels of and Expenditures on Financial Knowledge
(FK). These figures report average levels of financial knowledge ft as well as average annual expenditures on financial knowledge π(it), by age and education levels. See also Figure 1.
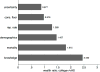
Figure 5. Decomposition of Wealth Inequality at…
Figure 5. Decomposition of Wealth Inequality at Retirement
This figure reports simulated median wealth divided…
Figure 5. Decomposition of Wealth Inequality at Retirement
This figure reports simulated median wealth divided by average lifetime income, expressed as a ratio of the College+ to high school dropouts (
Figure 6. Simulated Life-Cycle Wealth and Fraction…
Figure 6. Simulated Life-Cycle Wealth and Fraction of Wealth invested in the Sophisticated Technology with…
Figure 6. Simulated Life-Cycle Wealth and Fraction of Wealth invested in the Sophisticated Technology with Alternative Preference Specifications
These figures trace the share of wealth invested in the technology and median wealth by age and education under three scenarios. The top panel refers to our baseline scenario; the middle panel allows for heterogeneity in preferences; and the bottom panel assumes Epstein-Zin preferences. See also text and Figure 1 for definitions. (Additional detail is provided in the online appendix.)
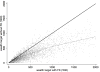
Figure 7. Comparison of Simulated Predicted Wealth…
Figure 7. Comparison of Simulated Predicted Wealth at Retirement: Base Case and Scenario Without Financial…
Figure 7. Comparison of Simulated Predicted Wealth at Retirement: Base Case and Scenario Without Financial Knowledge (FK)
This figure reports simulated wealth targets at retirement (age 65, in $000) under two scenarios for the same individuals (same income shocks and initial conditions). The first scenario (wealth target with FK) is generated using the baseline where individuals can invest in financial knowledge if it is optimal to do so. The second scenario (wealth target without FK) assumes individuals cannot invest in financial knowledge. Each dot represents a pair of simulated wealth targets. The 45-degree line is also plotted as well. Individuals above the 45-degree line have accumulated less wealth under the FK scenario than under the scenario without FK, and vice versa. We also plot a non-parametric estimate of the relationship between the two targets (dotted line).
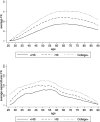
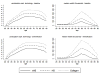
Figure 8. Simulated Life-Cycle Wealth and Fraction…
Figure 8. Simulated Life-Cycle Wealth and Fraction Investing in the Technology with Learning-by-Doing
These figures…
Figure 8. Simulated Life-Cycle Wealth and Fraction Investing in the Technology with Learning-by-Doing
These figures report the simulated life-cycle profiles of median wealth and the fraction investing in the technology by level of education, for individuals who can invest only in their financial knowledge using a learning-by-doing technology. The accumulation of knowledge follows from ft+1 = δft + ϕI(κt > 0). Profiles are plotted for two values of ϕ : (5,10). See also text and Figure 1 for definitions.
Figure 9. Life Cycle Simulated Path with…
Figure 9. Life Cycle Simulated Path with Diversification Benefits to Investing in Financial Knowledge
These…
Figure 9. Life Cycle Simulated Path with Diversification Benefits to Investing in Financial Knowledge
These figures report the simulated life-cycle profiles of participation in the technology and median wealth, in a scenario where financial knowledge not only raises the expected return on the technology but also lowers the variance of returns. The standard deviation of returns is given by σ (ft) = σmax − θ ft with σmax = 0.25 and θ is fixed such that σ(100) = 0.15. See also text and Figure 1 for definitions.
Agarwal Sumit, Driscoll John C, Gabaix Xavier, Laibson David, Gabaix Xavier, Laibson David. Brookings Papers on Economic Activity. 2009. Fall. The Age of Reason: Financial Decisions over the Life Cycle and Implications for Regulation; pp. 51–107.
Angeletos George-Marios, Laibson David, Repetto Andrea, Tobacman Jeremy, Weinberg Stephen. The Hyperbolic Consumption Model: Calibration, Simulation and Empirical Evaluation. Journal of Economic Perspectives. 2001;15(3):47–68.
Aon Consulting. Replacement Ratio Study: A Measurement Tool for Retirement Planning. Global Corporate Marketing and Communications; 2008. ( www.aon.com/retire)
Attanasio Orazio, Banks James, Meghir Costas, Weber Guglielmo. Humps and Bumps in Lifetime Consumption. Journal of Economic and Business Statistics. 1999;17(1):23–35.