. 2017 May 30:8:15592.
doi: 10.1038/ncomms15592.

Pyk2 modulates hippocampal excitatory synapses and contributes to cognitive deficits in a Huntington's disease model

Affiliations

Pyk2 modulates hippocampal excitatory synapses and contributes to cognitive deficits in a Huntington's disease model

Albert Giralt et al. Nat Commun. .

Abstract

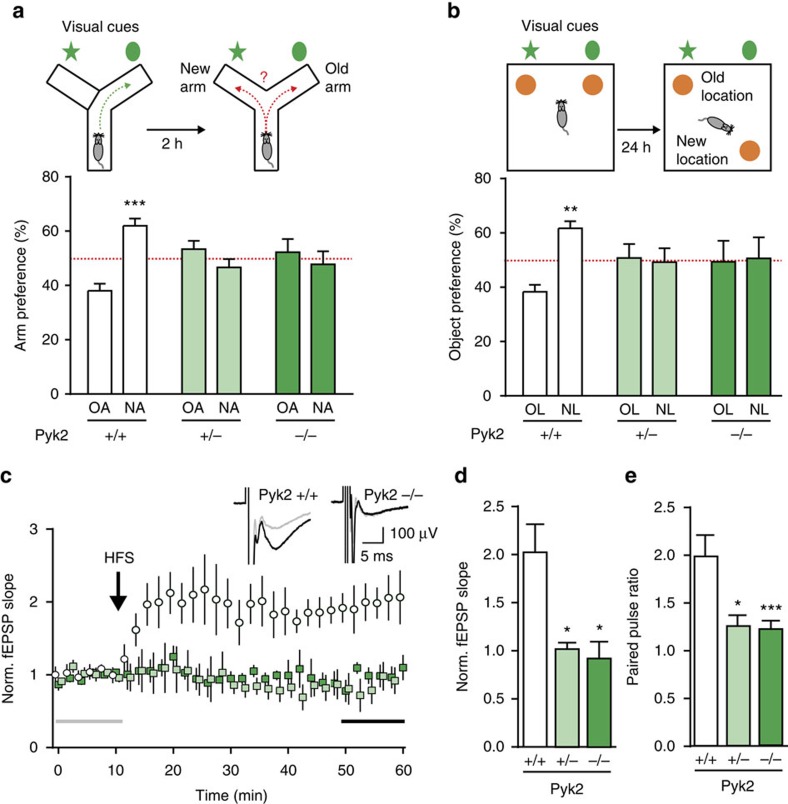
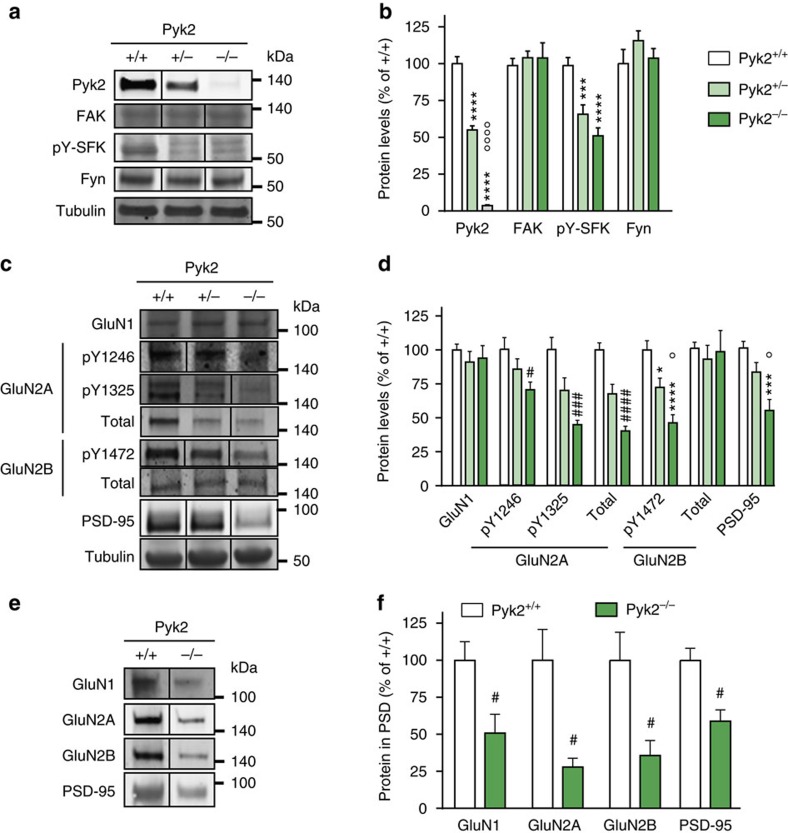
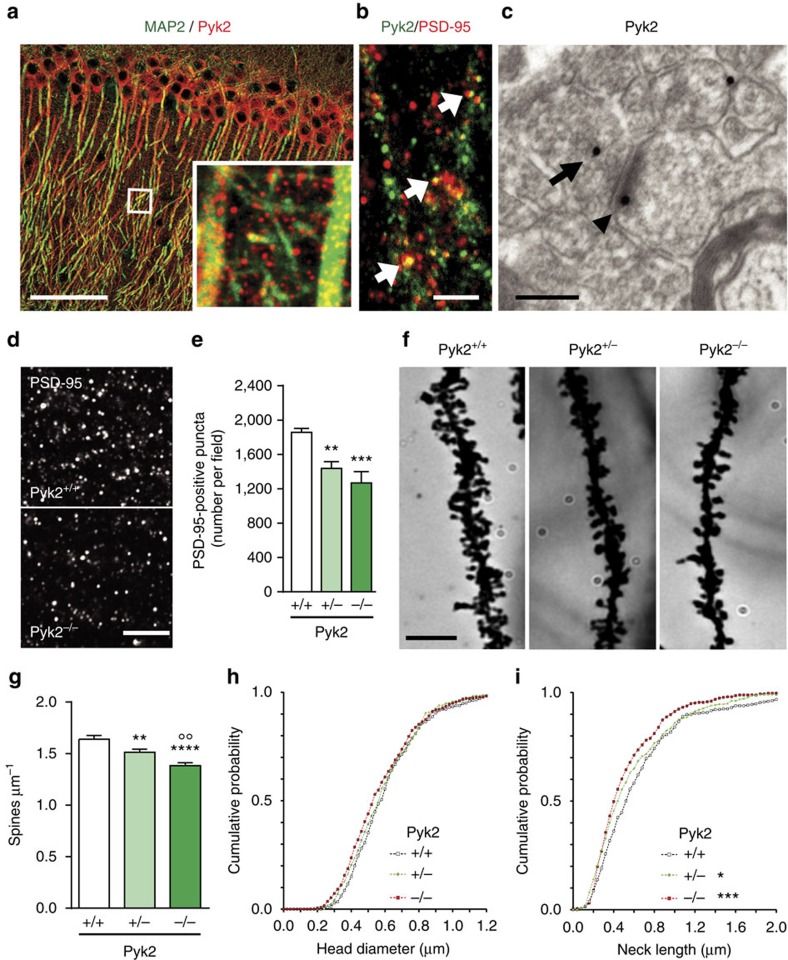
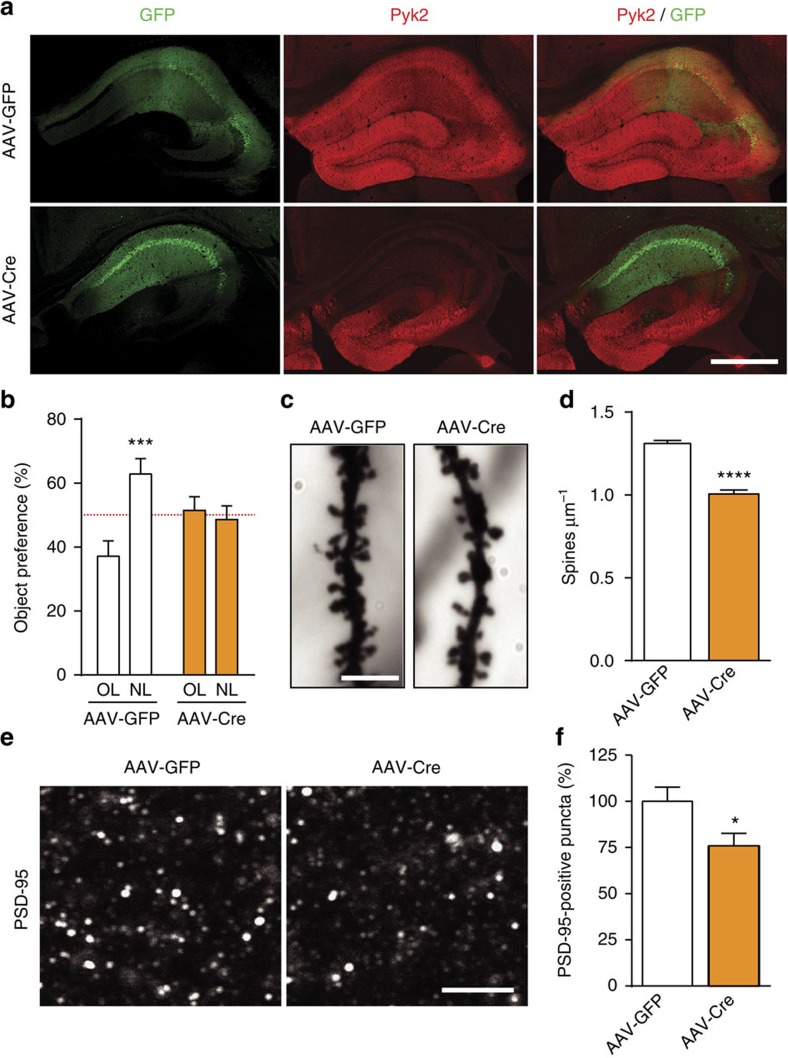
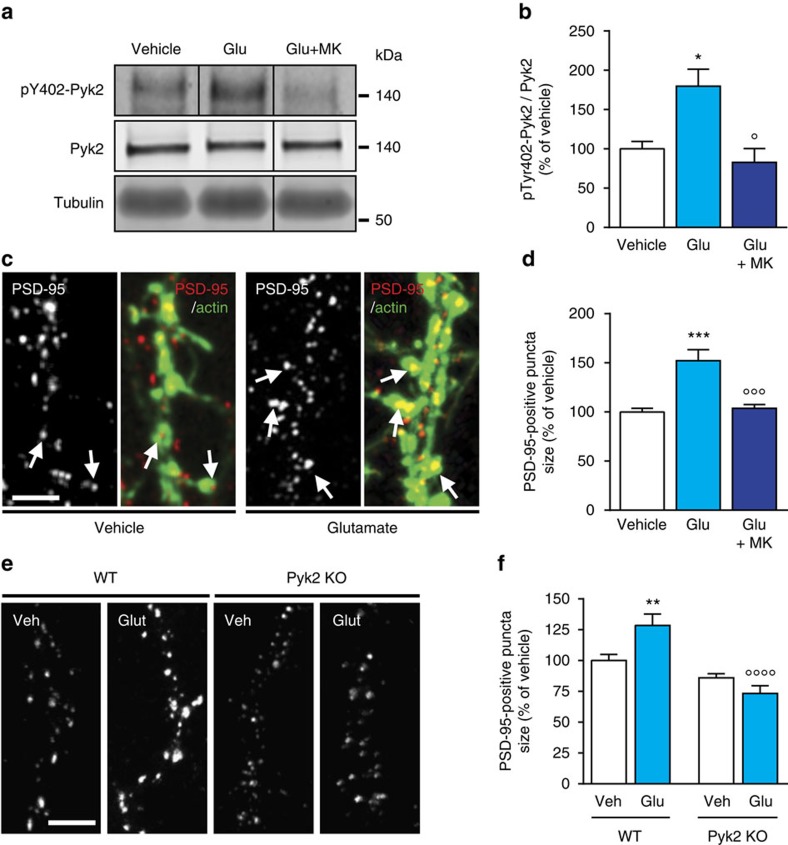
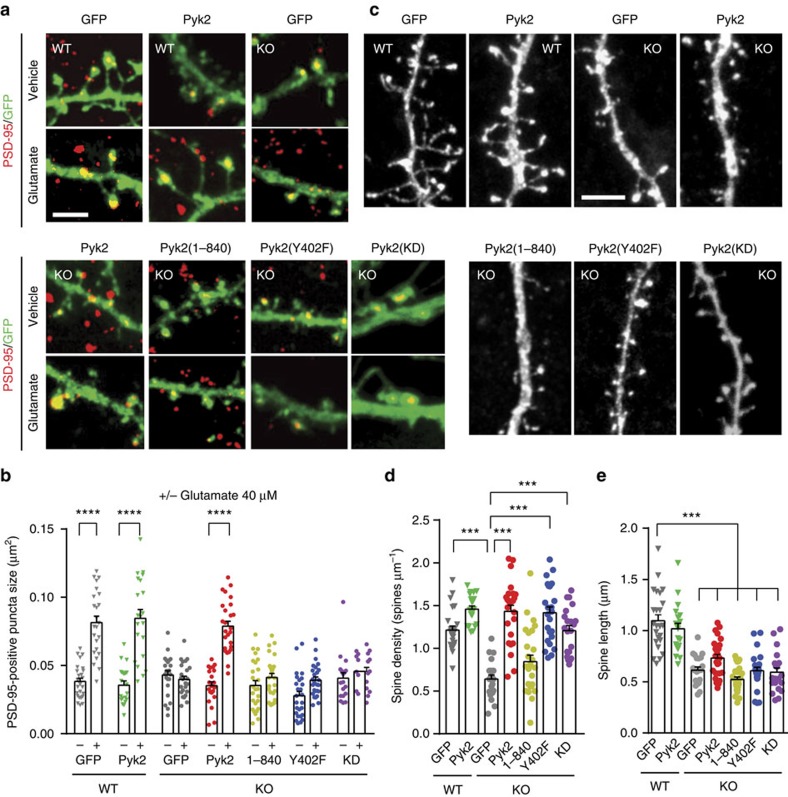
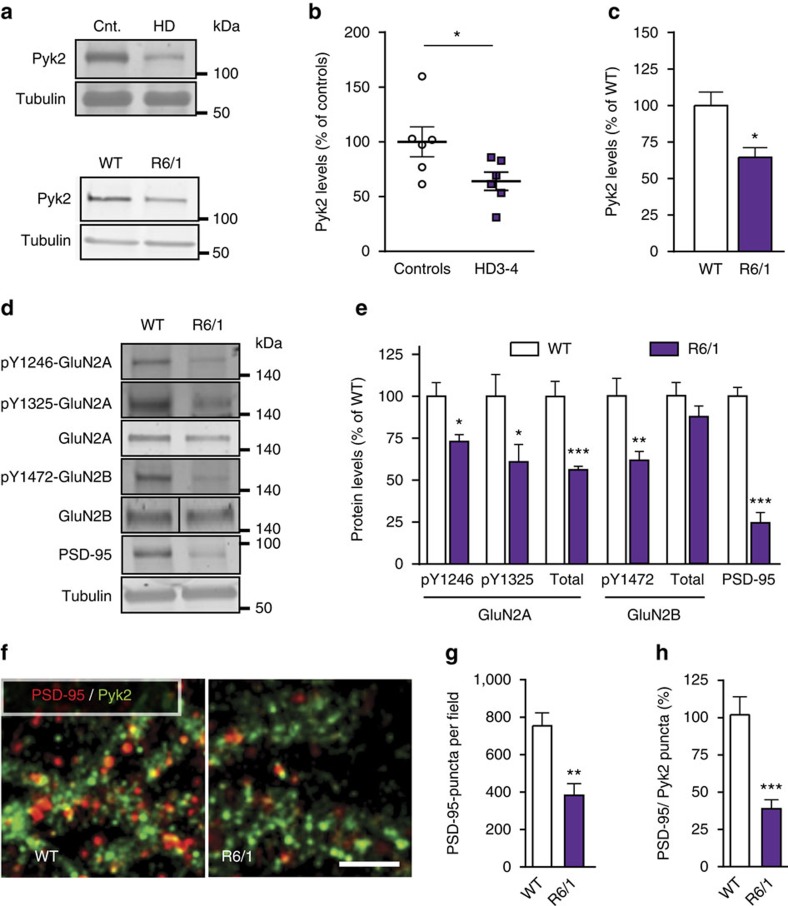
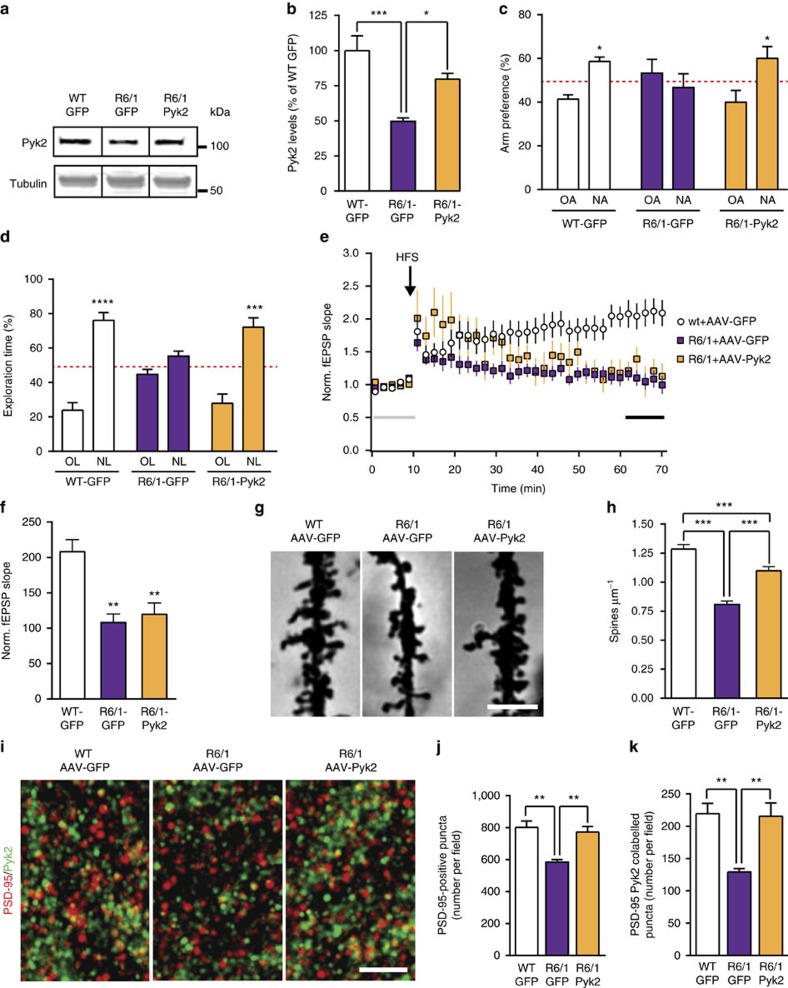
The structure and function of spines and excitatory synapses are under the dynamic control of multiple signalling networks. Although tyrosine phosphorylation is involved, its regulation and importance are not well understood. Here we study the role of Pyk2, a non-receptor calcium-dependent protein-tyrosine kinase highly expressed in the hippocampus. Hippocampal-related learning and CA1 long-term potentiation are severely impaired in Pyk2-deficient mice and are associated with alterations in NMDA receptors, PSD-95 and dendritic spines. In cultured hippocampal neurons, Pyk2 has autophosphorylation-dependent and -independent roles in determining PSD-95 enrichment and spines density. Pyk2 levels are decreased in the hippocampus of individuals with Huntington and in the R6/1 mouse model of the disease. Normalizing Pyk2 levels in the hippocampus of R6/1 mice rescues memory deficits, spines pathology and PSD-95 localization. Our results reveal a role for Pyk2 in spine structure and synaptic function, and suggest that its deficit contributes to Huntington's disease cognitive impairments.


Conflict of interest statement

The authors declare no competing financial interests.

Figures

Figure 1
Figure 1. Spatial learning and memory and CA1 LTP deficits in Pyk2 mutant mice.
(a) In the spontaneous alternation test, Pyk2+/+, Pyk2+/− and Pyk2−/− 3-month-old mice were placed for 10 min in a Y-maze with one arm closed (upper left panel). Two hours later, they were put in the same maze with the new arm (NA) open and the percentage of time exploring the NA and the previously explored (old arm, OA) was compared (upper right panel). Two-way ANOVA interaction F(2,48)=11.6, P<0.0001, OA versus NA Holm-Sidak's test, Pyk2+/+, t=4.6, P<0.0001, Pyk2+/−, t=1.58, Pyk2−/−, t=0.81. (b) In the NOL test, the percentage of time exploring the displaced object (new location, NL, 24 h after first exposure) and the unmoved object (old location, OL) was compared (upper panels). Two-way ANOVA interaction F(2,50)=3.41, P=0.041, OL versus NL Holm-Sidak's test, Pyk2+/+, t=3.1, P<0.01, Pyk2+/−, t=0.23, Pyk2−/−, t=0.14. In a,b, 7–12 mice were used per genotype; the red dotted line indicates the chance level. (c,d) Schaffer collaterals were stimulated in hippocampal slices (one–three slices per animal) from 3-4-week-old Pyk2+/+ (n=5), Pyk2+/− (n=6) and Pyk2−/− (n=4) mice, and fEPSP were recorded in CA1, before and after HFS (5 × 1 s at 100 Hz). (c) Time course of fEPSP slope. Insets show typical traces before (grey) and 40 min after (black) HFS in Pyk2+/+ and Pyk2−/− slices. (d) Ten-min average of fEPSP slope 40 min after HFS, normalized to the mean of 10- min baseline (corresponding time points are indicated in c by grey and black horizontal lines). Kruskal–Wallis=9.37, P=0.0024, post hoc analysis with Dunn's multiple comparisons test. (e) Paired-pulse ratio (50-ms interval, see Supplementary Fig. 1e) at the same synapses. n=3–5 mice per group, two–four slices per mouse. Kruskal–Wallis=15.62, P=0.0004. In ae, values are means+s.e.m., *P<0.05, **P<0.01, ***P<0.001.
Figure 2
Figure 2. Hippocampal proteins phosphorylation and levels in Pyk2-deficient mice.
(a) Immunoblotting analysis of Pyk2, the related tyrosine kinase FAK, the active autophosphorylated form of Src-family kinases (pY-SFK, pTyr-420 in Fyn), Fyn and tubulin as a loading control in 3-month-old Pyk2+/+, Pyk2+/− and Pyk2−/− littermates. (b) Densitometry quantification of results as in a. Data were normalized to tubulin for each sample and expressed as percentage of wild type. (c) NMDA receptors subunits phosphorylated residues, total levels and PSD-95 were analysed by immunoblotting. (d) Results as in c were quantified and analysed as indicated in b. In b and d, statistical analysis was done with one-way ANOVA and Holm-Sidak's multiple comparisons test or Kruskal–Wallis and Dunn's test depending on the normality of distribution (see Supplementary Table 1 for tests used, values and number of mice). (e) PSD fraction was prepared from hippocampus of Pyk2+/+ and Pyk2−/− mice and NMDA receptor subunits and PSD-95 were analysed in this fraction by immunoblotting. (f) Quantification of immunoblots as in e. Data are expressed as a percentage of the mean values in wild-type PSDs. Two-tailed Mann and Whitney test (n=7+/+ and 5−/−): GluN1, t10=3.52, P=0.0056, GluN2A, t10=2.68, P=0.023, GluN2B, t10=2.69, P=0.022, PSD-95, t10=2.66, P=0.024. In a,c,e, molecular weight markers positions are indicated in kDa. In b,d, Holm-Sidak's versus wild type, *P<0.05, **P<0.01, ***P<0.001 and ****P<10−4; significant differences between −/− and −/+ are indicated with °P<0.05, °°P<0.01 and °°°°P<10−4. In Dunn's test (d) and Mann and Whitney's test (f), significant differences versus wild type are indicated with # P<0.05, ### P<0.01 and #### P<10−4. In all graphs, data are means+s.e.m. Uncropped blots for a,c and e are shown in Supplementary Figs 5, 6 and 7, respectively.
Figure 3
Figure 3. Pyk2 localization and dendritic spine density and morphology in Pyk2-deficient mice.
(a,b) Confocal microscopy images of CA1 stratum radiatum immunostained for (a) Pyk2 (red) and MAP2 (green; inset, higher magnification of the indicated white box) and for (b) Pyk2 (green) and PSD-95 (red; white arrows, double-labelled puncta). Scale bars, 80 μm (a) and 3 μm (b). (c) Electron microscopy in the same region showing of Pyk2 immunoreactive gold particles in a presynaptic terminal (arrow) and a PSD (arrowhead). Scale bar, 0.2 μm. (d) Immunofluorescence PSD-95-positive puncta in the CA1 stratum radiatum from Pyk2+/+ and Pyk2−/− mice. Scale bar, 5 μm. (e) Quantification of puncta as in d. Data are means+s.e.m. (7–10 mice per genotype, three quantified sections per mouse). One-way ANOVA F(2,21)=10.23, P=0.0008. Holm-Sidak's multiple comparisons test versus +/+, **P<0.01, ***P<0.001. (f) Golgi-Cox-stained apical dendrites of CA1 stratum radiatum pyramidal neuron from Pyk2+/+, Pyk2+/− and Pyk2−/− mice. Scale bar, 3 μm. (g) Quantification of spine density in dendrites as in f, three–four animals per genotype, one-way ANOVA, F(2,146)=14.95, P<10−4 (n=47–54 dendrites per group), post hoc analysis with Holm-Sidak's multiple comparisons test versus +/+, **P<0.01, ****P<10−4 and −/− versus −/+, °°P<0.01. (h,i) Cumulative probability of spine head diameter (h, n=80) and spine neck length (i, n=115) in ∼60 dendrites from three–four animals per genotype. Distributions were compared with the Kolmogorov–Smirnov test: spine head diameter no significant difference, neck length +/+ versus +/−, D=0.108, P=0.04, +/+ versus −/−, D=0.154, P=0.0005. In e,g, data are means+s.e.m. All mice were 3–4-month old.
Figure 4
Figure 4. Pyk2 ablation in CA1 from adult mice induces spatial learning deficits and spine alterations.
(a) Mice with floxed Pyk2 alleles (Pyk2f/f, 4-week-old) were bilaterally injected in dorsal hippocampus CA1 with AAV expressing GFP (AAV-GFP) or GFP-Cre (AAV-Cre). GFP fluorescence (green) and Pyk2 immunoreactivity (red) were detected with confocal microscope (stitched pictures). With both viruses widespread, GFP expression is present in CA1 and Pyk2 is reduced in CA1 of AAV-Cre-injected mice. Scale bar, 200 μm. (b) AAV-GFP and AAV-Cre mice were subjected to the NOL test as in Fig. 1b and the percentage of time exploring the displaced object (NL) compared to that exploring the unmoved object (OL). Two-way ANOVA interaction F(1,44)=9.94, P=0.003, OL versus NL Holm-Sidak's test, AAV-GFP, t=4.0, P<0.001, AAV-Cre, t=0.45, ns (12 mice per group). The red dotted line indicates the chance level. (c) Representative Golgi-Cox-stained apical dendrites from CA1 pyramidal neurons of AAV-GFP and AAV-Cre mice. Scale bar, 4 μm. (d) Quantification of spine density in dendrites stained as in c, 81–86 dendrites from four mice per genotype. Student's t-test t165=10.1, P<10−4. (e) PSD-95 immunoreactive puncta in CA1 stratum radiatum of AAV-GFP and AAV-Cre mice. Scale bar, 4 μm (c,e). (f) Quantification of PSD-95-positive puncta density as in e, three sections per mouse, six–eight mice per genotype, Student's t-test t12=2.36, P<0.5. In a,d,f, data are means+s.e.m., *P<0.05, ***P<0.001 and ****P<10−4.
Figure 5
Figure 5. Pyk2 modulates glutamate-induced PSD-95 accumulation in dendritic spines.
(a) Hippocampal neurons were cultured for 3 weeks and treated for 15 min with vehicle or glutamate (Glu, 40 μM) without or with MK801 (MK, 10 μM), added 30 min before. PhosphoTyr402-Pyk2 (pY402-Pyk2), Pyk2 and α-tubulin as a loading control were analysed by immunoblotting. Molecular weight markers position is indicated in kDa. (b) Densitometric quantification of results as in a. One-way ANOVA (F(2,13)=8.02, P=0.005, n=4–7 per group) and post hoc Holm-Sidak's test for multiple comparisons. (c) Cultured hippocampal neurons were treated with vehicle or glutamate (40 μM) without or with MK801 (10 μM) for 3 h, fixed and labelled for PSD-95 immunoreactivity and rhodamine–phalloidin (an F-actin marker) to identify PSD-95-positive puncta localized in dendritic spines (arrows). (d) The size of these PSD-95-positive puncta was measured and analysed with one-way ANOVA (F(2,30)=15.37, P<0.0001, n=10–12 per group) and Holm-Sidak's test. (e) Hippocampal neurons from wild-type (WT) or Pyk2 KO mice were treated for 3 h with vehicle (Veh) or glutamate (40 μM) and immunostained for PSD-95. (f) The size of spine-associated PSD-95-positive puncta was measured in Pyk2+/+ and Pyk2−/− hippocampal cultures treated as in e and quantified (n=18–27 per group). Statistical analysis with two-way ANOVA (interaction F(1,89)=12.42, P=0.0007, glutamate effect, F(1,89)=1.84, P=0.18, genotype effect, F(1,89)=35.29, P<10−4) and post hoc multiple comparisons Holm-Sidak's test. In d,f, one–two dendrites per neuron from two to three independent experiments were measured. In b,d,f, data are means+s.e.m., *P<0.05, **P<0.01, ***P<0.001, as compared to vehicle-treated Pyk2+/+ cultures; °P<0.05, °°°P<0.001 and °°°°P<10−4, as compared to glutamate-treated Pyk2+/+ cultures. Scale bars, 5 μm (c and e). Uncropped blots for a are shown in Supplementary Fig. 8.
Figure 6
Figure 6. Autophosphorylation-dependent and -independent roles of Pyk2 in dendritic spines.
(a) Hippocampal neurons from wild-type (WT) and Pyk2 KO mice were cultured for 21–22 days, transfected with plasmids coding GFP or GFP fused to wild-type Pyk2, to Pyk2(1-840), Pyk2(Y402F) or Pyk2-KD (as indicated), and treated with vehicle or glutamate (Glu, 40 μM, 3 h). Neurons were imaged for GFP fluorescence (green) and PSD-95 immunoreactivity (red). (b) Quantification of GFP/PSD-95 double-positive puncta size (that is, yellow puncta) as in a. Two-way ANOVA: interaction, F(6,312)=19.07, P<10−4, glutamate effect, F(1,312)=134.3, P<10−4, Pyk2 expression effect, F(6,312)=20.06, P<10−4. (c) Spine density and length were studied in similar conditions as in a, in the absence of treatment, using GFP or Pyk2:GFP fluorescence. (d) Quantification of spine density. One-way ANOVA: F(6,155)=24.90, P<10−4. (e) Quantification of spine length. One-way ANOVA: F(6,157)=30.68, P<10−4 and. In b,d,e, individual data points and means+s.e.m. are shown, 15–20 dendrites per condition (one–two dendrites per neuron) from two to three independent experiments. Post hoc multiple comparisons were done with Holm-Sidak's test (b,d,e), ***P<0.001, ****P<10−4. Scale bars, 3 μm (a) and 1 μm (c).
Figure 7
Figure 7. Hippocampal alterations of Pyk2 and synaptic markers in Huntington's disease.
(a) Hippocampal post-mortem samples from human patients grades 3–4 (HD3-4) and controls (Cnt., top panel) and from wild-type (WT) mice and R6/1 transgenic mice (lower panel) were analysed by immunoblotting for Pyk2 and α-tubulin as a loading control. Molecular weight marker positions are indicated in kDa. (b) Densitometric quantification of results as in a, for human samples expressed as a percentage of the mean in controls (n=6 per group, Student's t-test, t10=2.25, P<0.05). (c) Quantification of results as in a for WT and R6/1 mice (percentage of WT mean, n=4–6 mice per group, Student's t-test, t8=3.23, P=0.012). (d) Immunoblotting for phosphorylated forms and total GluN2A and GluN2B, and PSD-95 in hippocampus of WT and R6/1 mice. (e) Quantification of results as in d (percentage of WT mean), Student's t-test, pY1246-GluN2A, t9=3.10, P=0.013, pY1325-GluN2A, t9=2.37, P=0.04, GluN2A, t9=5.21, P=0.0006, pY1472-GluN2B, t8=3.64, P=0.0066, GluN2B, t8=1.22, P=0.26, PSD-95, t9=9.18, P<10−4. (f) Confocal images of the stratum radiatum of CA1hippocampal sections from WT and R6/1 mice immunolabelled for PSD95 (red) and Pyk2 (green). Scale bar, 10 μm. (g,h) Quantification of results as in f in (three slices per mouse, five–six mice per genotype. (g) Number of PSD95-positive puncta, Student's t-test, t9=3.98, P=0.003. (h) Number of Pyk2/PSD-95-double-positive puncta, expressed as a percentage of WT mean, Student's t-test, t10=4.66, P=0.0009. All data are means+s.e.m. *P<0.05, **P<0.01 and ***P<0.001. R6/1 mice were 5-month old. Uncropped blots for a and d are shown in Supplementary Figs 9 and 10, respectively.
Figure 8
Figure 8. Pyk2 protein levels restoration in the hippocampus partly rescues R6/1 mice phenotype.
(a) Pyk2 and α-tubulin (loading control) immunoblotting in 3-month WT mice injected with AAV-GFP (WT-GFP), or R6/A injected with AAV-GFP (R6/1-GFP) or AAV-Pyk2 and GFP (R6/1-Pyk2). Uncropped blots in Supplementary Fig. 11. (b) Quantification of results as in a (six–nine mice per group). One-way ANOVA: F(2,18)=4.39, P<0.05, Holm-Sidak's test versus R6/1-GFP. (c) Y-maze spontaneous alternation test (10–11 mice per group). Two-way ANOVA interaction F(2,56)=4.39, P<0.05, OA versus NA, Holm-Sidak's test WT-GFP t=2.64, P<0.05, R6/1-GFP, t=0.97, ns, R6/1-Pyk2, t=2.93, P<0.05. (d) NOL test (9–12 mice per group). Two-way ANOVA interaction F(2,54)=11.9, P<0.0001, OL versus NL, Holm-Sidak's test WT-GFP t=9.08, P<0.0001, R6/1-GFP, t=1.60, ns, R6/1-Pyk2, t=6.66, P<0.0001. (e) LTP studied as in Fig. 1c in hippocampal slices from 5-month WT-GFP, R6/1-GFP and R6/1-Pyk2 mice (n=3–4 mice per group, 2–3 slices per mouse, 10–11 slices total). (f) Ten-min average of fEPSP slope 40 min after HFS, normalized to the mean of 10-min baseline (corresponding time points are indicated in e by an horizontal line). Kruskal–Wallis=15.63, P<0.05, post hoc analysis with Dunn's multiple comparisons test. (g) Golgi-Cox-stained apical dendrites from CA1 pyramidal neurons. Scale bar, 3 μm. (h) Quantitative analysis of dendritic spine density as in e (59–62 dendrites from four mice per group). One-way ANOVA: F(2,177)=46.7, P<10−4, Holm-Sidak's test versus R6/1-GFP. (i) Hippocampal sections of WT and R6/1 mice injected with AAV-GFP or AAV-Pyk2 as indicated, and double-immunostained for PSD-95 and Pyk2. High magnification in CA1 stratum radiatum is shown. Scale bar, 5 μm. (j) Quantification of PSD-95-positive puncta density. One-way ANOVA F(2,14)=10.81, P=0.0014, Holm-Sidak's multiple comparisons test. (k) Quantification of PSD-95/Pyk2 double-positive puncta density. One-way ANOVA F(2,14)=9.76, P=0.0022, Holm-Sidak's multiple comparisons test. In j,k, five–seven mice per group. In all graphs values are means+s.e.m. *P<0.05, **P<0.01, ***P<0.001 and ****P<10−4.

Comment in

References

    1. Girault J. A., Costa A., Derkinderen P., Studler J. M. & Toutant M. FAK and PYK2/CAKbeta in the nervous system: a link between neuronal activity, plasticity and survival? Trends Neurosci. 22, 257–263 (1999). - PubMed
    1. Salter M. W. & Kalia L. V. Src kinases: a hub for NMDA receptor regulation. Nat. Rev. Neurosci. 5, 317–328 (2004). - PubMed
    1. Lev S. et al. Protein tyrosine kinase PYK2 involved in Ca(2+)-induced regulation of ion channel and MAP kinase functions. Nature 376, 737–745 (1995). - PubMed
    1. Menegon A. et al. FAK+ and PYK2/CAKbeta, two related tyrosine kinases highly expressed in the central nervous system: similarities and differences in the expression pattern. Eur. J. Neurosci. 11, 3777–3788 (1999). - PubMed
    1. Bartos J. A. et al. Postsynaptic clustering and activation of Pyk2 by PSD-95. J. Neurosci. 30, 449–463 (2010). - PMC - PubMed

Publication types

MeSH terms