. 2017 May 30:8:15494.
doi: 10.1038/ncomms15494.

TGF-β activation by bone marrow-derived thrombospondin-1 causes Schistosoma- and hypoxia-induced pulmonary hypertension

Affiliations

TGF-β activation by bone marrow-derived thrombospondin-1 causes Schistosoma- and hypoxia-induced pulmonary hypertension

Rahul Kumar et al. Nat Commun. .

Abstract

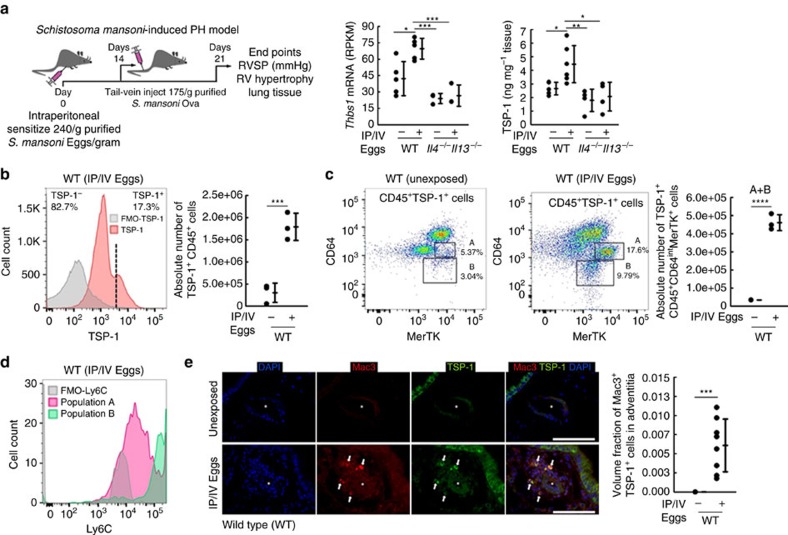
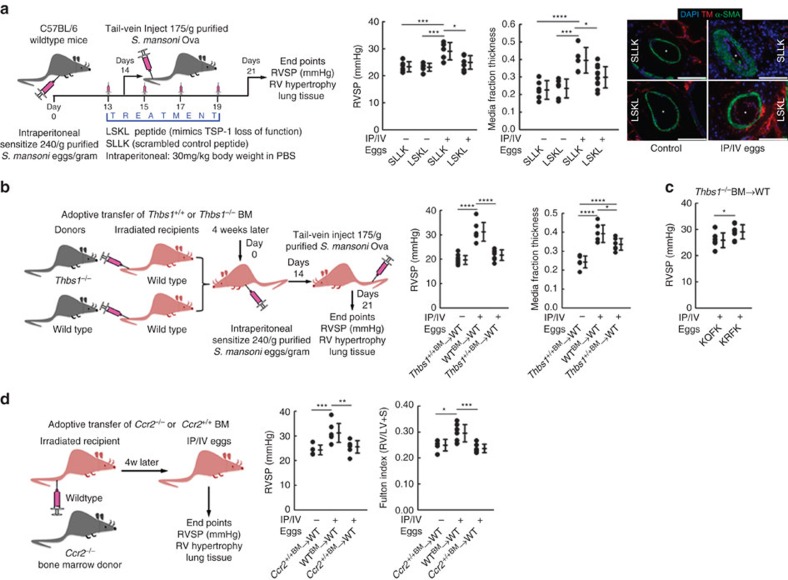
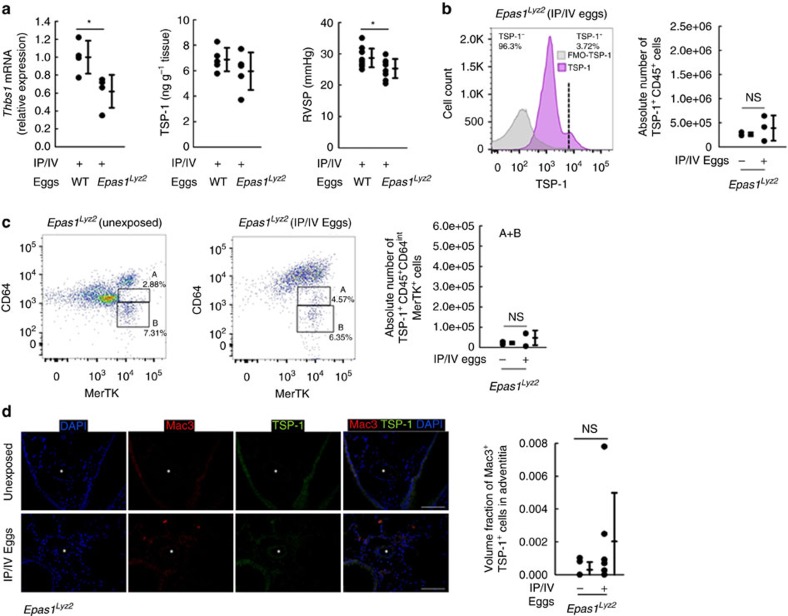
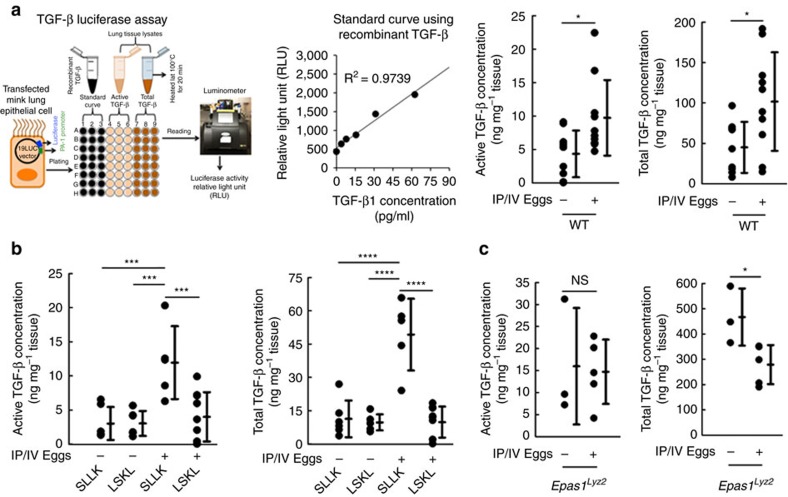
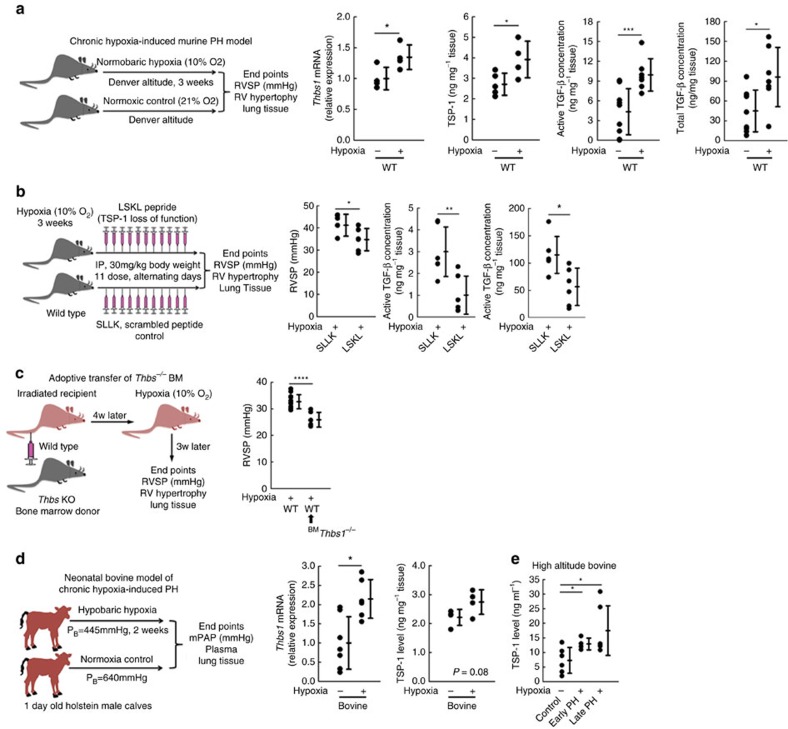
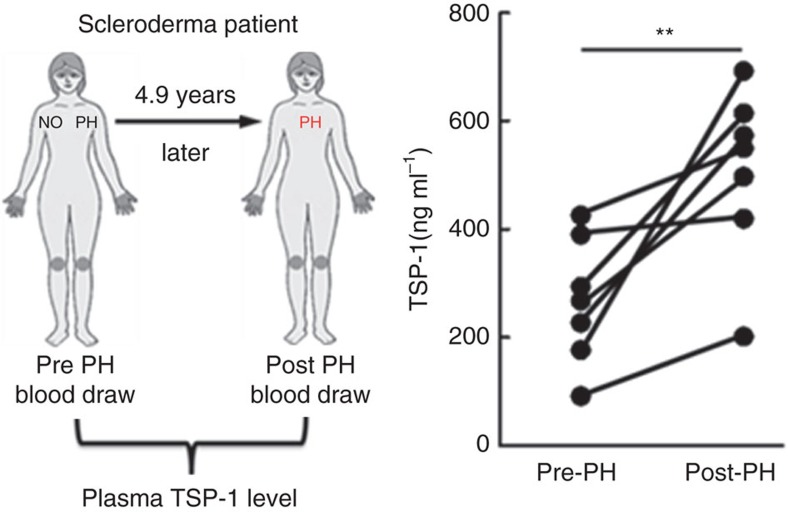
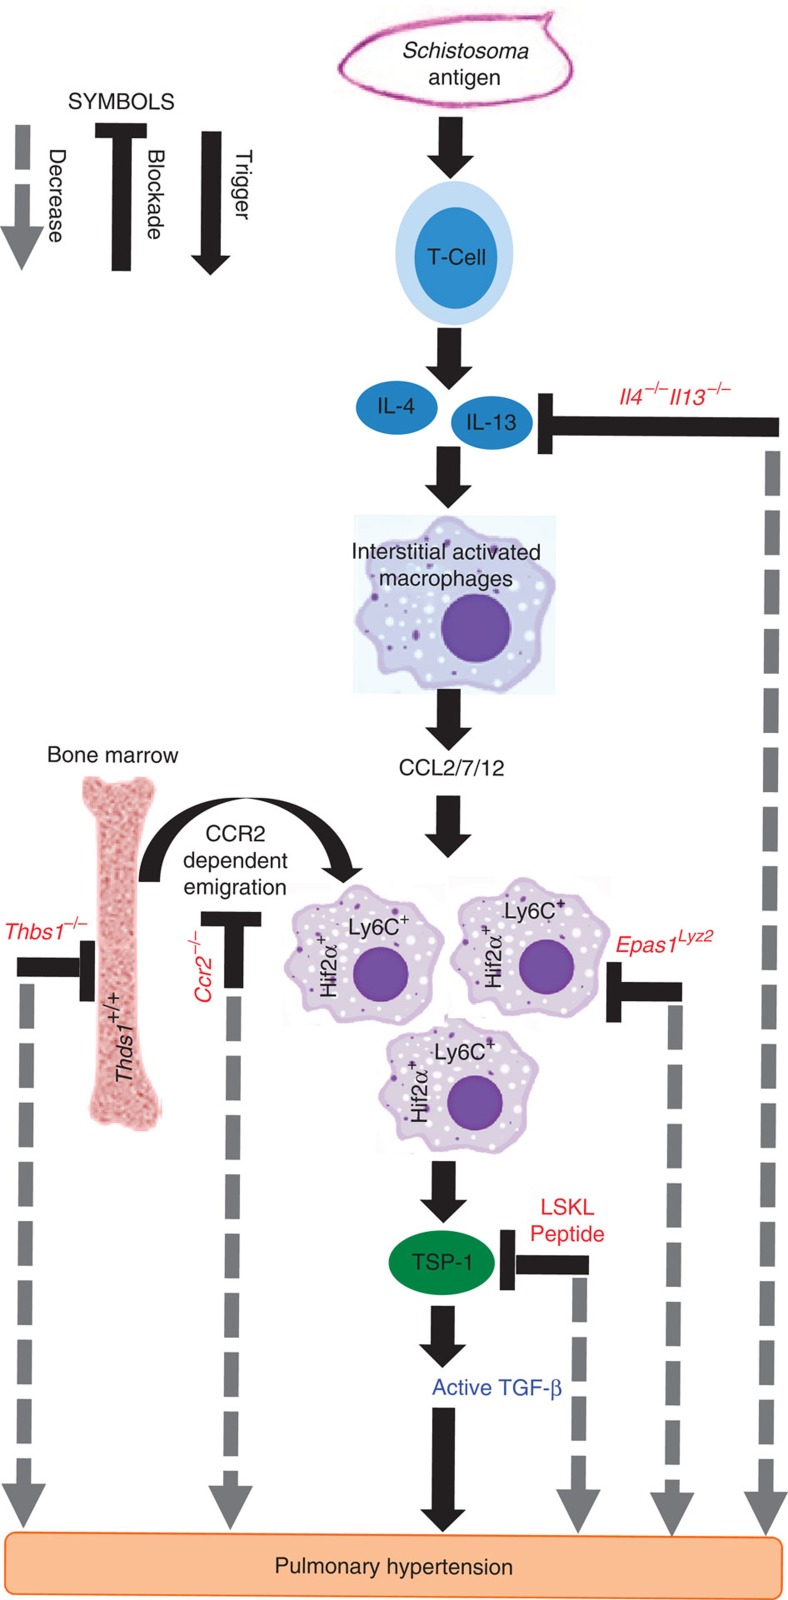
Pulmonary arterial hypertension (PAH) is an obstructive disease of the precapillary pulmonary arteries. Schistosomiasis-associated PAH shares altered vascular TGF-β signalling with idiopathic, heritable and autoimmune-associated etiologies; moreover, TGF-β blockade can prevent experimental pulmonary hypertension (PH) in pre-clinical models. TGF-β is regulated at the level of activation, but how TGF-β is activated in this disease is unknown. Here we show TGF-β activation by thrombospondin-1 (TSP-1) is both required and sufficient for the development of PH in Schistosoma-exposed mice. Following Schistosoma exposure, TSP-1 levels in the lung increase, via recruitment of circulating monocytes, while TSP-1 inhibition or knockout bone marrow prevents TGF-β activation and protects against PH development. TSP-1 blockade also prevents the PH in a second model, chronic hypoxia. Lastly, the plasma concentration of TSP-1 is significantly increased in subjects with scleroderma following PAH development. Targeting TSP-1-dependent activation of TGF-β could thus be a therapeutic approach in TGF-β-dependent vascular diseases.


Conflict of interest statement

The authors declare no competing financial interests.

Figures

Figure 1
Figure 1. Effect of S. mansoni exposure on TSP-1 expression and localization.
(a) Whole-lung concentrations of Thbs1 mRNA by RNA-seq (n=5, 5, 3 and 3 mice/group, respectively; RPKM: reads per kilobase per million mapped reads; analysis of variance (ANOVA) P<0.001, with post hoc Tukey tests shown) and protein concentration by ELISA (n=5, 6, 4 and 4 mice/group, respectively; ANOVA P<0.005, with post hoc Tukey tests shown) in wild-type and Il4−/−Il13−/− mice unexposed or with Schistosoma mansoni-induced PH. (b) Representative histogram and quantification of number of CD45+ singlet cells from whole-lung tissue digest, which stain positive for intracellular TSP-1 by flow cytometry from unexposed or Schistosoma exposed mice (FMO: fluorescence minus one, that is, no TSP-1 antibody; n=3 mice/group; t-test). (c) Sorting on the CD45+TSP-1+ population in unexposed and Schistosoma-exposed samples identifies the recruited TSP-1+ cells to be CD64intMerTK+ with two subpopulations, labelled ‘A' and ‘B' as shown (n=3/group; t-test). (d) Histogram of Ly6C expression intensity in the ‘A' and ‘B' populations, relative to FMO (fluorescence minus one: no Ly6C antibody; representative of n=3 repetitions/group). (e) Representative immunostaining for TSP-1 and Mac3 (macrophage marker), and quantification of the volume fraction of TSP-1+Mac3+ cells in the adventitia of vessels by stereology (asterisk: vessel lumen; arrows: representative positive double-stained cells; scale bars: 50 μm; n=5 and 8 mice/group, respectively; t-test). (Mean±s.d. plotted; P values: *P<0.05; **P<0.01; ***P<0.005, ****P<0.001; IP/IV: intraperitoneal/intravenous S. mansoni eggs).
Figure 2
Figure 2. Effect of TSP-1 blockade on Schistosoma-induced pulmonary hypertension.
(a) Right ventricular systolic pressure (RVSP) of unexposed or Schistosoma-exposed wild-type (WT) mice treated with LSKL, which inhibits the TGF-β activation function of TSP-1 (or equivalent volume of scrambled control peptide SLLK), and quantitative fractional thickness of the pulmonary vascular media by morphometry (n=6, 6, 5 and 11 mice/group, respectively; analysis of variance (ANOVA) P<0.001 for both RVSP and media thickness, with post hoc Tukey tests shown; asterisks: vessel lumen; scale bars: 50 μm). (b) RVSP and media thickness in irradiated WT recipients of either WT or Thbs1−/− bone marrow (BM), followed by no treatment or Schistosoma exposure (n=10, 7 and 7 mice/group, respectively; ANOVA P<0.001 for both RVSP and media thickness, with post hoc Tukey tests shown). (c) RVSP in WT recipients of Thbs1−/− BM, followed by Schistosoma exposure, and then treated with either KRFK, which mimics the TGF-β activation function of TSP-1 (or equivalent volume of control peptide KQFK; n=7 and 8 mice/group, respectively; t-test). (d) RVSP and Fulton index in irradiated WT recipients of either WT or Ccr2−/− BM, followed by no treatment or Schistosoma exposure (the data for WT recipients of WT BM are the same data shown in b; n=5, 7 and 7 mice/group, respectively; ANOVA P<0.001 for both RVSP and media thickness, with post hoc Tukey tests shown). (Mean±s.d. plotted; P values: *P<0.05; **P<0.01, ***P<0.005, ****P<0.001; IP/IV: intraperitoneal/intravenous S. mansoni eggs).
Figure 3
Figure 3. Pathologic TSP-1 is regulated by HIF2α in Schistosoma-induced pulmonary hypertension.
(a) Whole-lung Thbs1 mRNA quantity by RT–PCR and TSP-1 protein by ELISA (n=4, 4; 5 and 5 mice/group, respectively; 2ΔCt; relative to β-actin housekeeping gene; t-test) and RVSP (n=11 and 9 mice/group, respectively; t-test) in Epas1fl/fl x Lyz2-Cre mice (abbreviated as Epas1Lyz2) either unexposed or Schistosoma-exposed. (b) Representative histogram and quantification of number of CD45+ singlet (FMO: no TSP-1 antibody; three repetitions/group, y axis is similar to wild-type data in Fig. 1b) cells from whole-lung tissue digest, which stain positive for intracellular TSP-1 by flow cytometry from unexposed or Schistosoma exposed mice). (c) Flow cytometry and quantification of the two CD45+TSP-1+ populations ‘A' and ‘B' (as in Fig. 1c; n=3/group; t-test, NS=non-significant). (d) Representative immunostaining for TSP-1 and Mac3 (macrophage marker), and quantification of the volume fraction of TSP-1+Mac3+ cells in the adventitia of vessels by stereology (asterisk: vessel lumen; arrows: representative positive double-stained cells; scale bars: 100 μm; n=6 mice/group; t-test). (Mean±s.d. plotted; P values: *P<0.05, NS=non-significant; IP/IV: intraperitoneal/intravenous S. mansoni eggs).
Figure 4
Figure 4. Assessment of active and total TGF-β in whole-lung lysates using a cell-based reporter assay.
(a) The experimental scheme and standard curve of luciferase assay using mink lung epithelial cells (MLECs) transfected with PAI-1 promoter fused to firefly luciferase reporter gene, using recombinant TGF-β1 to correlate luciferase activity with TGF-β concentration, and quantification of the concentration of active and total (by heat treating the sample) TGF-β in whole-lung lysates of wild-type mice unexposed or Schistosoma-exposed (n=9, 10; 9 and 10 mice/group, respectively; t-test). (b) Concentration of active and total TGF-β in whole-lung lysates from WT mice unexposed or Schistosoma-exposed, and treated with LSKL or SLLK (n=6, 6, 5, 9; 6, 6, 5 and 9 mice/group, respectively; analysis of variance (ANOVA) P<0.001 for both active and total concentrations, with post hoc Tukey tests shown). (c) Concentration of active and total TGF-β from whole-lung lysates from Epas1fl/fl x Lyz2-Cre mice unexposed or Schistosoma-exposed (n=3, 5; 3 and 5 mice/group; t-test). (Mean±s.d. plotted; P values: *P<0.05, ***P<0.005, ****P<0.001, NS=non-significant; IP/IV: intraperitoneal/intravenous S. mansoni eggs).
Figure 5
Figure 5. Assessment of TSP-1 in hypoxia-induced pulmonary hypertension in mice and cows.
(a) In mice maintained at normoxia or following 3 weeks of 10% FiO2 hypoxia, whole-lung Thbs1 mRNA by RT–PCR (n=4 mice/group; 2ΔCt; relative to β-actin housekeeping gene; t-test) and protein by ELISA (n=5 and 4 mice/group, respectively; t-test), and concentrations of active and total TGF-β using the MLEC assay (n=9, 7; 9 and 7 mice/group, respectively; t-test). (b) RVSP in hypoxia-exposed WT mice treated with LSKL or SLLK (n=6 mice/group; t-test), and concentrations of active and total TGF-β in whole-lung lysates following SLLK and LSKL treatment using the MLEC assay (n=6 mice/group; t-test). (c) RVSP of WT mice or WT recipients of Thbs1−/− bone marrow, followed by chronic hypoxia exposure (n=13 and 6 mice/group, respectively; t-test). (d) Thbs1 mRNA transcript and TSP-1 protein level in newborn cows exposed to 2 weeks of normoxia or hypobaric hypoxia (n=7, 6; 4 and 4 animals/group, respectively; 2ΔCt; relative to HPRT housekeeping gene; t-test). (e) TSP-1 protein concentration by ELISA in high altitude controls and matched early and late PH adolescent bovine plasma samples (n=6, 4 and 6 animals/group, respectively; t-test). (Mean±s.d. plotted; P values: *P<0.05; **P<0.01; ***P<0.005, ****P<0.001).
Figure 6
Figure 6. Assessment of plasma TSP-1 in subjects with scleroderma-associated disease.
Plasma concentration of TSP-1 in scleroderma subjects before and after development of PAH (mean delay=4.9 years; n=7 subjects; paired t-test; P value: **P<0.01).
Figure 7
Figure 7. Overall signalling pathways and intervention approach.
Schematic of signalling pathways linking activation of immune cells by Schistosoma exposure with TGF-β activation by TSP-1, and subsequent vascular remodelling and PH. Schistosoma exposure leads to Th2 inflammation and release of the cytokines IL-4 and IL-13. These cause activation of interstitial or tissue macrophages, which release CCL2, CCL7 and CCL12. These ligands promote recruitment via CCR2 of bone marrow-derived Ly6C+ monocytes into the adventitial space of the lung vasculature, where they bring in TSP-1 (the expression of which is Hif2α-dependent) to locally activate TGF-β. Active TGF-β then results in remodelling of the pulmonary artery vessel cells, resulting in PH. In red are identified systematic interventions that block causal steps and protect against PH in these experimental models.

References

    1. Simonneau G. et al.. Updated clinical classification of pulmonary hypertension. J. Am. Coll. Cardiol. 62, D34–D41 (2013). - PubMed
    1. Tuder R. M. et al.. Relevant issues in the pathology and pathobiology of pulmonary hypertension. J. Am. Coll. Cardiol. 62, D4–12 (2013). - PMC - PubMed
    1. Graham B. B. et al.. Transforming growth factor-β signaling promotes pulmonary hypertension caused by Schistosoma mansoni. Circulation 128, 1354–1364 (2013). - PMC - PubMed
    1. Richter A. et al.. Impaired transforming growth factor-beta signaling in idiopathic pulmonary arterial hypertension. Am. J. Respir. Crit. Care Med. 170, 1340–1348 (2004). - PubMed
    1. Lane K. B. et al.. Heterozygous germline mutations in BMPR2, encoding a TGF-beta receptor, cause familial primary pulmonary hypertension. Nat. Genet. 26, 81–84 (2000). - PubMed

Publication types

MeSH terms

Substances