

Variation in cannabis potency and prices in a newly legal market: evidence from 30 million cannabis sales in Washington state
- PMID: 28556310
- PMCID: PMC5673542
- DOI: 10.1111/add.13886
Variation in cannabis potency and prices in a newly legal market: evidence from 30 million cannabis sales in Washington state
Abstract
Aims: To (1) assess trends and variation in the market share of product types and potency sold in a legal cannabis retail market and (2) estimate how potency and purchase quantity influence price variation for cannabis flower.
Design: Secondary analysis of publicly available data from Washington State's cannabis traceability system spanning 7 July 2014 to 30 September 2016. Descriptive statistics and linear regressions assessed variation and trends in cannabis product variety and potency. Hedonic regressions estimated how purchase quantity and potency influence cannabis flower price variation.
Setting: Washington State, USA.
Participants: (1) A total of 44 482 176 million cannabis purchases, including (2) 31 052 123 cannabis flower purchases after trimming price and quantity outliers.
Measurements: Primary outcome measures were (1) monthly expenditures on cannabis, total delta-9-tetrahydrocannabinol (THC) concentration and cannabidiol (CBD) concentration by product type and (2) excise tax-inclusive price per gram of cannabis flower. Key covariates for the hedonic price regressions included quantity purchased, THC and CBD.
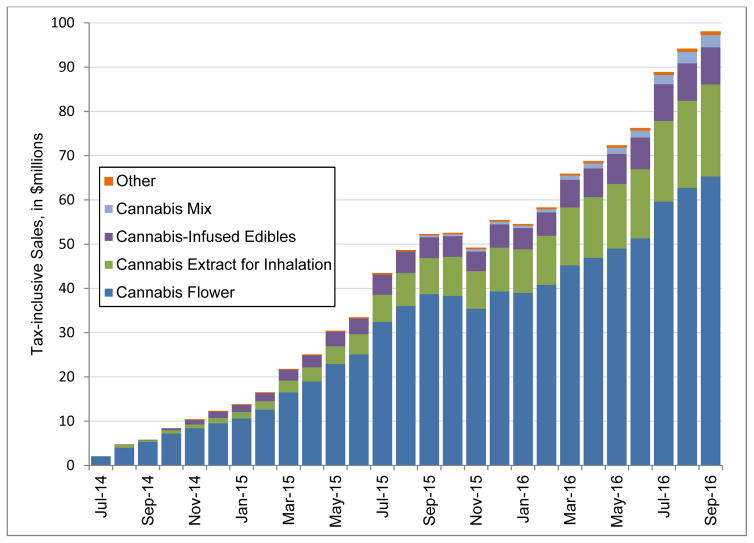
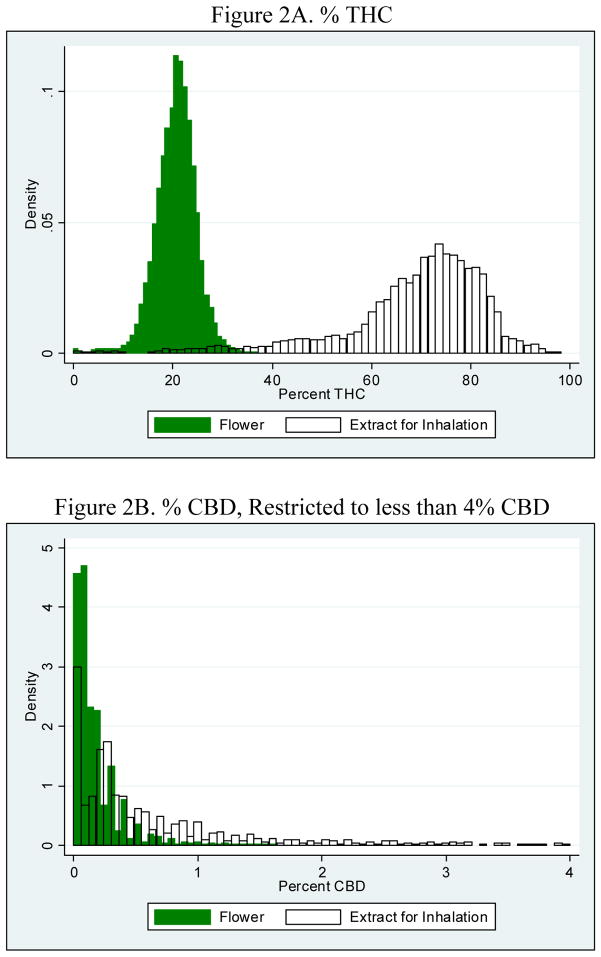
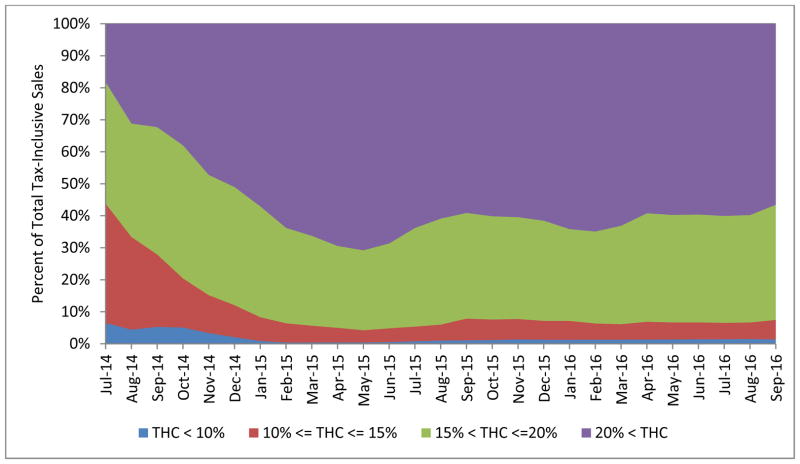
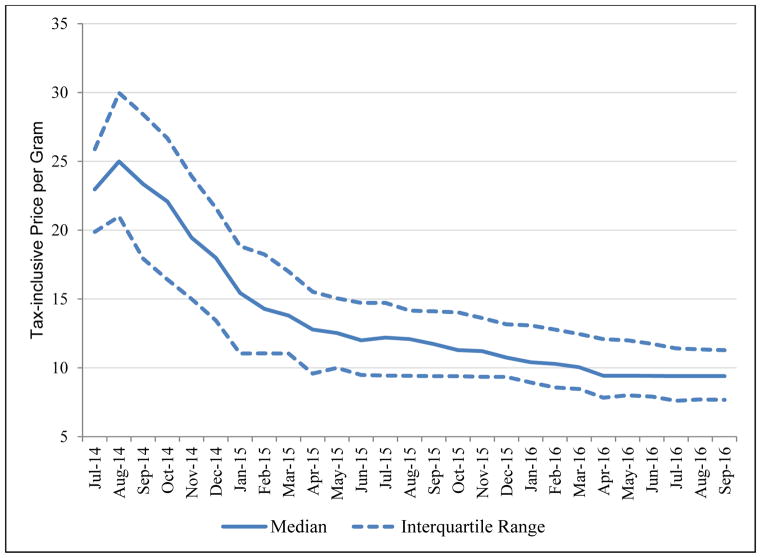
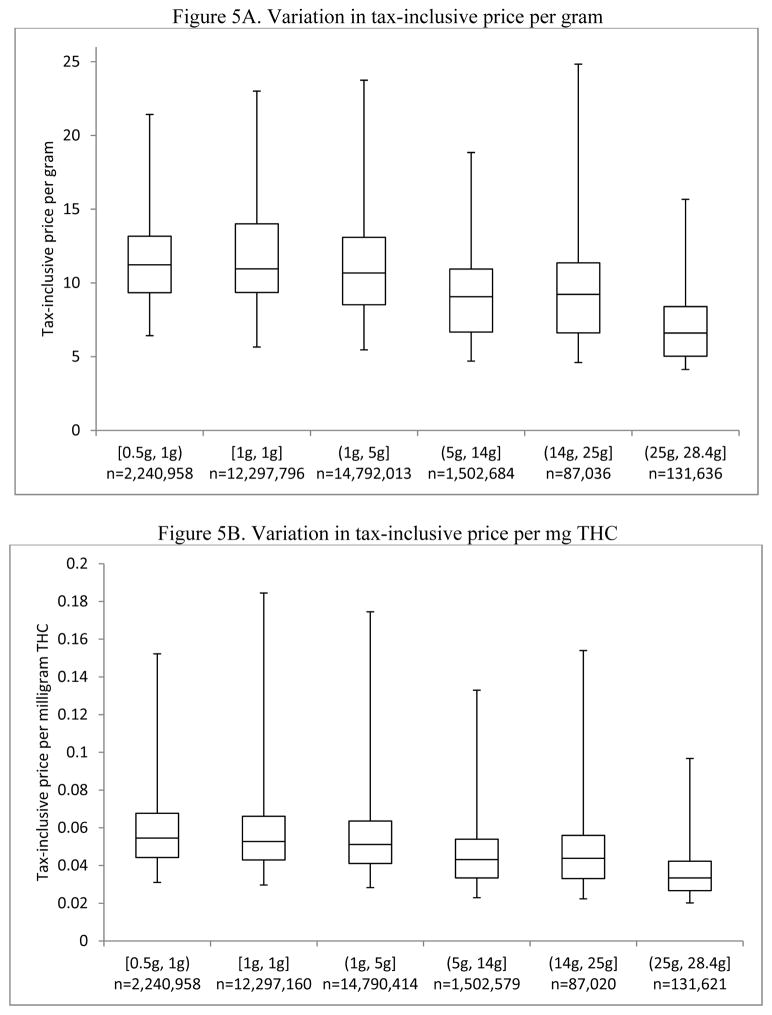
Findings: Traditional cannabis flowers still account for the majority of spending (66.6%), but the market share of extracts for inhalation increased by 145.8% between October 2014 and September 2016, now comprising 21.2% of sales. The average THC-level for cannabis extracts is more than triple that for cannabis flowers (68.7% compared to 20.6%). For flower products, there is a statistically significant relationship between price per gram and both THC [coefficient = 0.012; 95% confidence interval (CI) = 0.011-0.013] and CBD (coefficient = 0.017; CI = 0.015-0.019). The estimated discount elasticity is -0.06 (CI = -0.07 to -0.05).
Conclusions: In the state of Washington, USA, the legal cannabis market is currently dominated by high-THC cannabis flower, and features growing expenditures on extracts. For cannabis flower, both THC and CBD are associated with higher per-gram prices, and there are small but significant quantity discounts.
Keywords: Cannabis; drug policy; hedonic models; legalization; potency; prices.
© 2017 Society for the Study of Addiction.
Conflict of interest statement
Figures
Comment in
-
Response to Commentaries: new data sources for understanding cannabis markets.Addiction. 2017 Dec;112(12):2180-2181. doi: 10.1111/add.14051. Addiction. 2017. PMID: 29105915 Free PMC article. No abstract available.
-
The need for better marijuana sales data.Addiction. 2017 Dec;112(12):2179-2180. doi: 10.1111/add.14037. Addiction. 2017. PMID: 29105917 Free PMC article.
-
Potency increase, product development and marijuana marketing in times of legalization.Addiction. 2017 Dec;112(12):2178-2179. doi: 10.1111/add.13945. Addiction. 2017. PMID: 29105921 No abstract available.
References
-
- Mclellan AA, Ware MA, Boyd S, Chow G, Jesso M, Kendall P, et al. A Framework for the Legalization and Regulation of Cannabis in Canada: The Final Report of the Task Force on Cannabis Legalization and Regulation. Ottawa, ON: Health Canada; 2016.
-
- Buckley WF. The war on drugs is lost. Natl Rev. 1996:34–48.
-
- Smith N. High potency cannabis: the forgotten variable. Addiction. 2005;100:1558–1560. - PubMed
-
- Ramaekers JG, Kauert G, Van Ruitenbeek P, Theunissen EL, Schneider E, Moeller MR. High-potency marijuana impairs executive function and inhibitory motor control. Neuropsychopharmacology. 2006;31:2296–2303. - PubMed
-
- Di Forti M, Marconi A, Carra E, Fraietta S, Trotta A, Bonomo M, et al. Proportion of patients in south London with first-episode psychosis attributable to use of high potency cannabis: a case-control study. Lancet Psychiatry. 2015;2:233–238. - PubMed
MeSH terms
Grants and funding
LinkOut - more resources
Full Text Sources
Other Literature Sources
Medical
