

Bias and inference from misspecified mixed-effect models in stepped wedge trial analysis
- PMID: 28556355
- PMCID: PMC5600088
- DOI: 10.1002/sim.7348
Bias and inference from misspecified mixed-effect models in stepped wedge trial analysis
Abstract
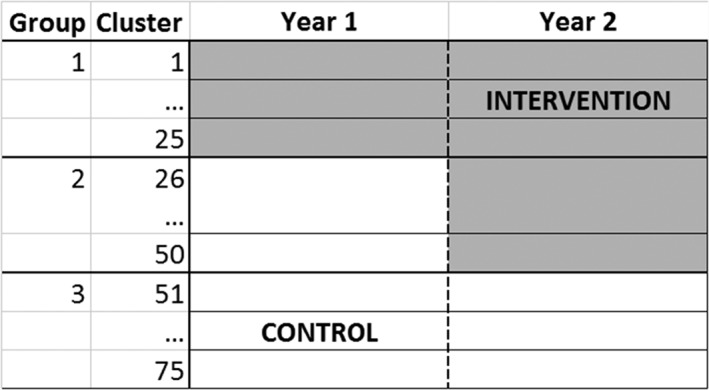
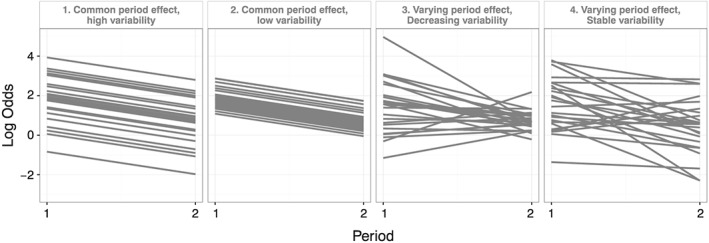
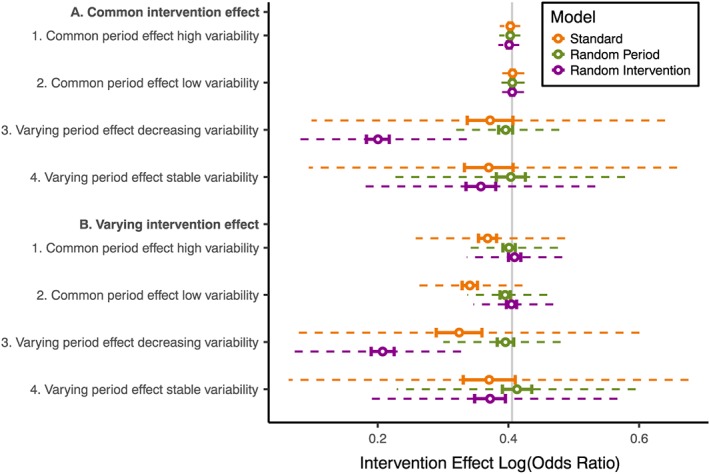
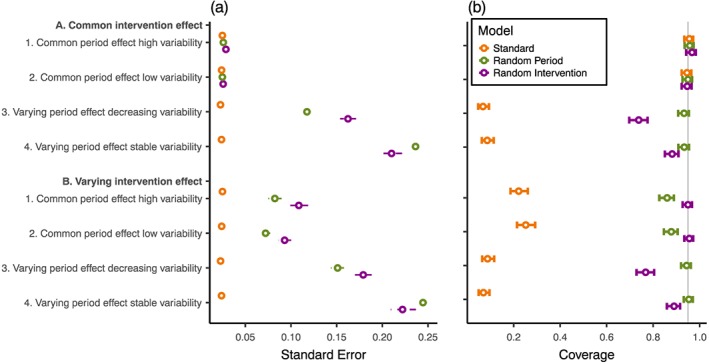
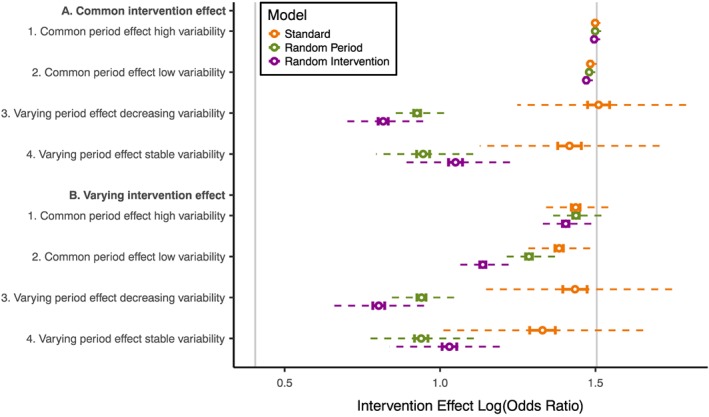
Many stepped wedge trials (SWTs) are analysed by using a mixed-effect model with a random intercept and fixed effects for the intervention and time periods (referred to here as the standard model). However, it is not known whether this model is robust to misspecification. We simulated SWTs with three groups of clusters and two time periods; one group received the intervention during the first period and two groups in the second period. We simulated period and intervention effects that were either common-to-all or varied-between clusters. Data were analysed with the standard model or with additional random effects for period effect or intervention effect. In a second simulation study, we explored the weight given to within-cluster comparisons by simulating a larger intervention effect in the group of the trial that experienced both the control and intervention conditions and applying the three analysis models described previously. Across 500 simulations, we computed bias and confidence interval coverage of the estimated intervention effect. We found up to 50% bias in intervention effect estimates when period or intervention effects varied between clusters and were treated as fixed effects in the analysis. All misspecified models showed undercoverage of 95% confidence intervals, particularly the standard model. A large weight was given to within-cluster comparisons in the standard model. In the SWTs simulated here, mixed-effect models were highly sensitive to departures from the model assumptions, which can be explained by the high dependence on within-cluster comparisons. Trialists should consider including a random effect for time period in their SWT analysis model. © 2017 The Authors. Statistics in Medicine published by John Wiley & Sons Ltd.
Keywords: cluster randomised trials; mixed-effect model; model misspecification; simulation study; stepped wedge trials.
© 2017 The Authors. Statistics in Medicine published by John Wiley & Sons Ltd.
Figures
References
-
- Miguel E, Kremer M. Worms: identifying impacts on education and health in the presence of treatment externalities. Econometrica 2004; 72:159–217.
-
- Hussey MA, Hughes JP. Design and analysis of stepped wedge cluster randomized trials. Contemporary Clinical Trials 2007; 28:182–191. - PubMed
MeSH terms
Grants and funding
LinkOut - more resources
Full Text Sources
Other Literature Sources