. 2017 Jul;6(7):458-468.
doi: 10.1002/psp4.12199. Epub 2017 May 27.

Translational Modeling to Guide Study Design and Dose Choice in Obesity Exemplified by AZD1979, a Melanin-concentrating Hormone Receptor 1 Antagonist

Affiliations

Translational Modeling to Guide Study Design and Dose Choice in Obesity Exemplified by AZD1979, a Melanin-concentrating Hormone Receptor 1 Antagonist

P Gennemark et al. CPT Pharmacometrics Syst Pharmacol. 2017 Jul.

Abstract

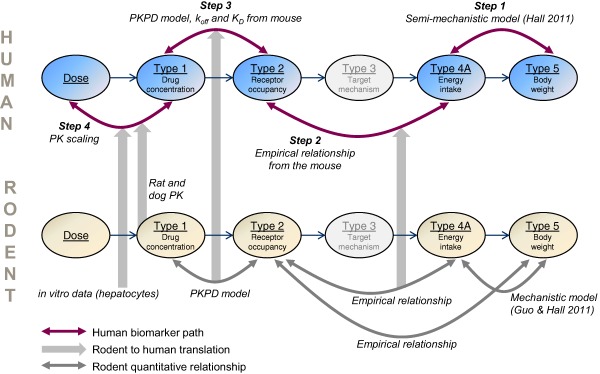
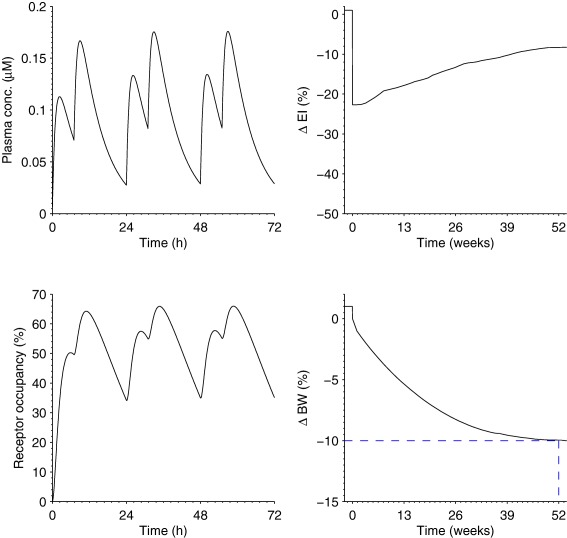
In this study, we present the translational modeling used in the discovery of AZD1979, a melanin-concentrating hormone receptor 1 (MCHr1) antagonist aimed for treatment of obesity. The model quantitatively connects the relevant biomarkers and thereby closes the scaling path from rodent to man, as well as from dose to effect level. The complexity of individual modeling steps depends on the quality and quantity of data as well as the prior information; from semimechanistic body-composition models to standard linear regression. Key predictions are obtained by standard forward simulation (e.g., predicting effect from exposure), as well as non-parametric input estimation (e.g., predicting energy intake from longitudinal body-weight data), across species. The work illustrates how modeling integrates data from several species, fills critical gaps between biomarkers, and supports experimental design and human dose-prediction. We believe this approach can be of general interest for translation in the obesity field, and might inspire translational reasoning more broadly.


Figures

Figure 1
Figure 1
Key components of the pharmacokinetic/pharmacodynamic (PK/PD) model and scaling path. The human biomarker path is indicated by purple arrows, the rodent to human translation is indicated by thick gray arrows, and supporting quantitative relationships in rodents are depicted by gray arrows. Steps 1–4 include both empirical and mechanistic models. Target‐mechanism data were lacking in the melanin‐concentrating hormone receptor 1 program, and this is indicated by the gray color of that biomarker.
Figure 2
Figure 2
Body weight (BW) to energy intake (EI) in humans (step 1). BW data (red circles) from 14 key studies with rimonabant, orlistat, sibutramine, taranabant, topiramate, lorcaserin, and phentermine. During treatment, BW decreases initially but then tends to plateau. Plausible reasons include compensatory mechanisms increasing appetite, low compliance, or drug tolerance development, or a combination of those. Nonparametric input‐estimation was used to predict EI (blue line) by regressing Hall's body‐composition model on BW observations. The predicted EI drops initially and then returns to a level close to the initial baseline. The predicted BW curves are indicated by green lines. A 1% (peak) drug‐induced energy‐expenditure effect was assumed. The shaded areas are 95% credible intervals of EI and BW.
Figure 3
Figure 3
Energy intake (EI) to receptor occupancy (RO) in rodents (step 2). The left column shows data for the mouse and the right column shows data for the rat. (a) Mouse EI and (c) body weight (BW) data for rimonabant (Rim) 10 mg/kg/day, and sibutramine (Sib) 10 mg/kg/day. Mouse BW data for topiramate (Top) was 66 mg/kg/day. (b) Rat EI and (d) BW data for Rim 10 mg/kg/day, taranabant (Tar) 3 mg/kg/day, Sib 5 mg/kg/day, and lorcaserin (Lor) 4 mg/kg/day. (e) BW reduction vs. EI reduction in the mouse. AZD1979 observations (squares = female and circles = males) indicate a linear relationship (solid line). The triangles indicate corresponding data for Rim and Sib. The model15, 16 prediction (dashed line) is based on the assumption that the drug mainly targets EI and not energy expenditure. The parallel shift indicates a minor effect of AZD1979 on energy expenditure. (f) BW reduction vs. EI reduction in the rat. AZD1979 observations (circles) indicate a linear relationship (solid line). The triangles denote corresponding data for Lor, Tar, Sib, and Rim. (g) BW reduction vs. RO at 24 h in the mouse. Data for AZD1979 and other compounds of the same chemical series indicate a linear relationship (circles represent AZD1979, squares represent compound 99, and triangles represent compound 88). (h) BW reduction vs. RO at 24 h in the rat. Data from the melanin‐concentrating hormone receptor 1 antagonist ALB indicate a linear relationship as for the mouse. (e–h) The thick gray lines indicate the point estimates that give the RO‐to‐EI relationships, one for the mouse and one for the rat.
Figure 4
Figure 4
Receptor occupancy (RO) in humans to exposure in humans (step 3). Mouse exposure and RO data and model fit. Each row represents one experiment. The left column reports exposure data (squares and circles) and pharmacokinetic (PK) model fit (solid and dashed lines) for various doses indicated by the legends. The PK model was defined by the absorption rate ka = 1.93 (1.6, 2.4) h−1, the volume of distribution of the first compartment V1 = 2.02 (1.6, 2.4) L × kg−1, the maximum elimination rate Vmax = 8.19 (7.6, 9.0) µmol × h−1 × kg−1, the Michaelis‐Menten constant Km = 2.44 (2.3, 2.8) µmol, the intercompartmental clearance Q = 1.54 (1.3, 1.8) L × h−1 × kg−1, the volume of distribution of the second compartment V2 = 5.01 (4.4, 5.7) L × kg−1, and σ2 = 0.104 (0.051, 0.15) µmol2 × L−2, whereas the 5th and 95th percentiles are given within brackets. The right column gives RO data (squares and circles) and pharmacodynamic (PD) model fit (solid and dashed lines) for the corresponding doses. In the PD model, the total receptor concentration (Rtot) was fixed on a relative scale at 100%, the rate constant koff = 0.210 (0.18, 0.25) h−1, the dissociation constant KD = 0.0837 (0.078, 0.091) µmol × L−1, and σ2 = 18.8 (8.9, 29) µmol2 × L−2. The upper row represents a single‐dose acute experiment on lean mice, whereas the bottom row represents an experiment with chronic twice daily dosing on diet‐induced obese mice.
Figure 5
Figure 5
Human dose‐prediction of AZD1979. Predicted plasma‐concentration (upper left), receptor occupancy (RO; lower left) that is >50% during 16 h of the day, energy‐intake (EI) profile (upper right) with a 1‐year average of −14%, and body‐weight (BW; lower right) profile reaching a 10% decrease in 1 year. The EI profile is a nonparametric curve obtained from the average of the inferred curves of the 14 drugs of step 1.

References

    1. Visser, S.A. et al Model‐based drug discovery: implementation and impact. Drug Discov. Today 18, 764–775 (2013). - PubMed
    1. Tuntland, T. et al Implementation of pharmacokinetic and pharmacodynamic strategies in early research phases of drug discovery and development at Novartis Institute of Biomedical Research. Front. Pharmacol. 5, 174 (2014). - PMC - PubMed
    1. Friedrich, C.M. A model qualification method for mechanistic physiological QSP models to support model‐informed drug development. CPT Pharmacometrics Syst. Pharmacol. 5, 43–53 (2016). - PMC - PubMed
    1. Gadkar, K. , Kirouac, D.C. , Mager, D.E. , van der Graaf, P.H. & Ramanujan, S. A six‐stage workflow for robust application of systems pharmacology. CPT Pharmacometrics Syst. Pharmacol. 5, 235–249 (2016). - PMC - PubMed
    1. Chang, C. et al Quantitative PK‐PD model‐based translational pharmacology of a novel kappa opioid receptor antagonist between rats and humans. AAPS J. 13, 565–575 (2011). - PMC - PubMed

MeSH terms