. 2017 May 30;7(5):e1138.
doi: 10.1038/tp.2017.112.

Blockade of interleukin-6 receptor in the periphery promotes rapid and sustained antidepressant actions: a possible role of gut-microbiota-brain axis

Affiliations

Blockade of interleukin-6 receptor in the periphery promotes rapid and sustained antidepressant actions: a possible role of gut-microbiota-brain axis

J-C Zhang et al. Transl Psychiatry. .

Abstract

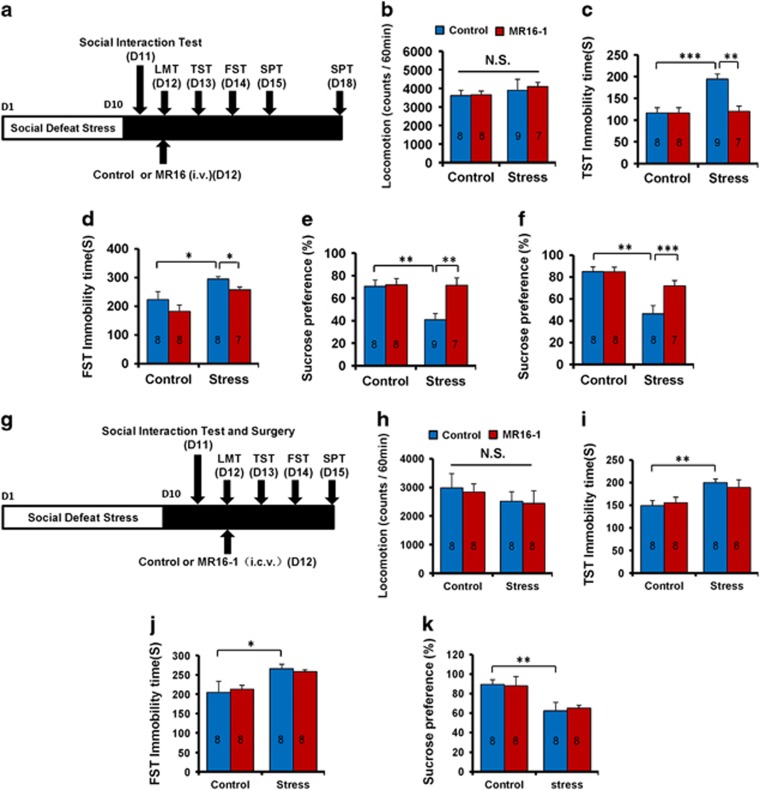
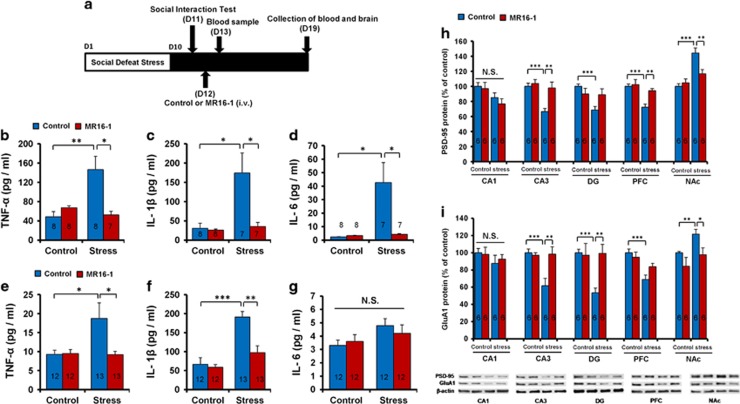
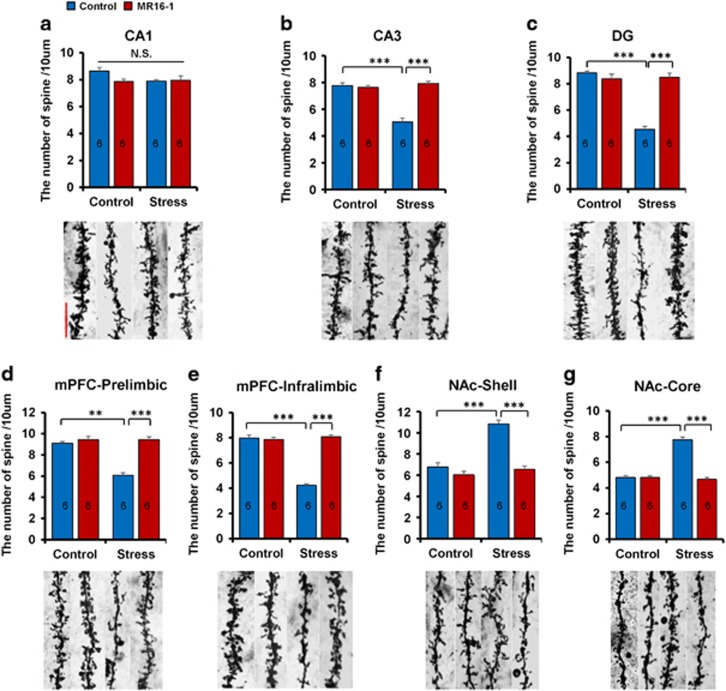
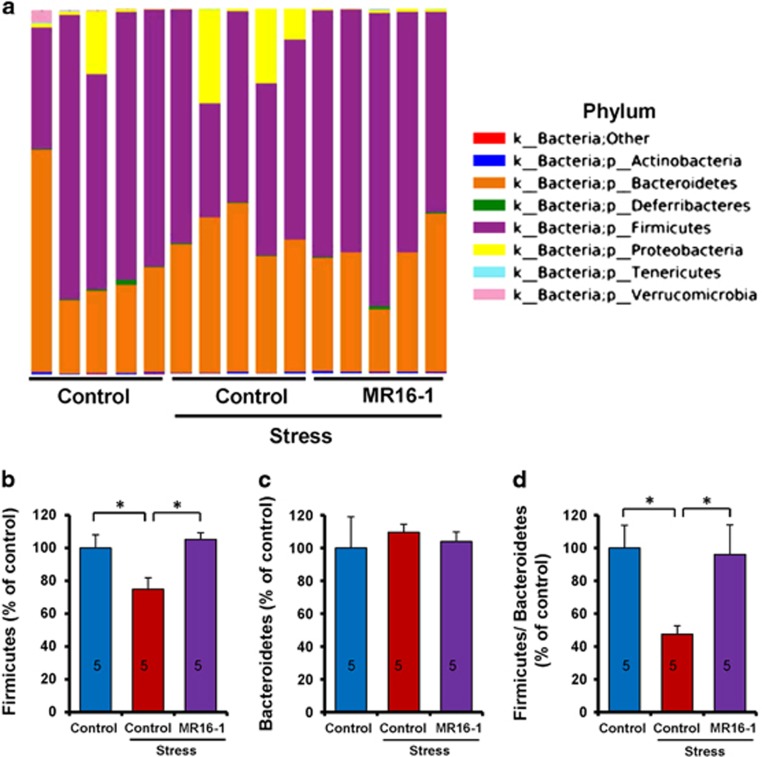
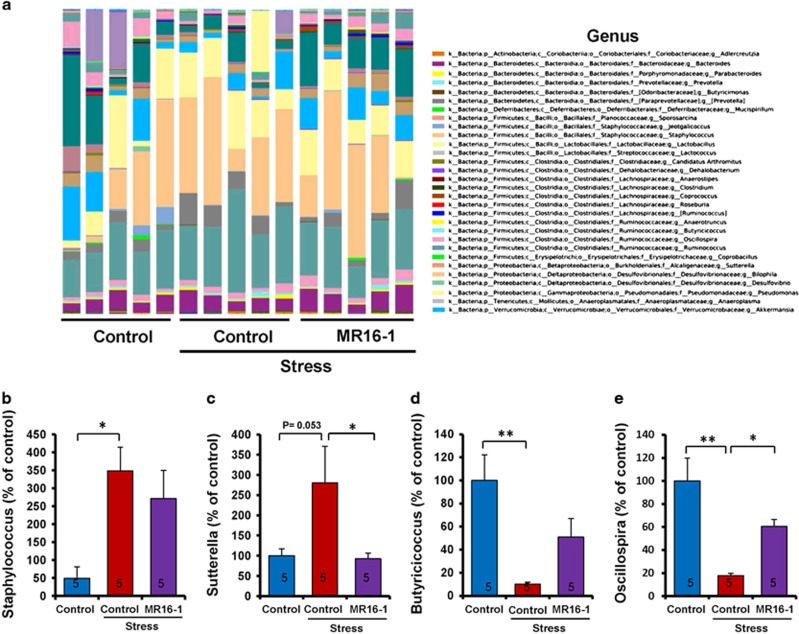
Depression is a common, severe and chronic psychiatric disease. Although the currently available antidepressants have been used in the treatment of depression, their beneficial effects are limited. Accumulating evidence suggests that pro-inflammatory cytokines such as interleukin-6 (IL-6) have an important role in the pathogenesis of depression. This study was undertaken to examine whether anti-mouse IL-6 receptor antibody (MR16-1) induces antidepressant effects in a social defeat stress model. Intravenous injection of MR16-1 induced rapid-onset and long-lasting antidepressant effects in susceptible mice after social defeat stress through its anti-inflammatory actions. In contrast, intracerebroventricular injection of MR16-1 induced no antidepressant effects in susceptible mice. Furthermore, treatment with MR16-1 could significantly normalize alterations in the expression of synaptic proteins (postsynaptic density protein 95 and α-amino-3-hydroxy-5-methyl-4-isoxazolepropionic acid receptor 1) and dendritic spine density in the brain regions of susceptible mice. Gut microbiota analysis using 16S ribosomal RNA gene sequencing showed that MR16-1 significantly improved decreased Firmicutes/Bacteroidetes ratio in susceptible mice. It also significantly improved decreased levels of Oscillospira in susceptible mice. These findings suggest that peripheral IL-6 has a key role in the pathogenesis of depression and that the blockade of IL-6 receptor in the periphery might have rapid-onset and long-lasting antidepressant effects by normalizing the altered composition of gut microbiota in susceptible mice after social defeat stress. Therefore, the blockade of IL-6 receptor in the periphery shows promise as a novel therapeutic approach for depressed patients with higher IL-6 blood levels.


Conflict of interest statement

The authors declare no conflict of interest.

Figures

Figure 1
Figure 1
Antidepressant effects of MR16-1 in social defeat stress model. (a) Schedule of social defeat stress (10 days), social interaction test, drug treatment (intravenous (i.v.)), and behavioral tests. (b) Locomotion test (LMT). (c) Tail suspension test (TST). (d) Forced swimming test (FST). (e) One % sucrose preference test (SPT). (f) One % SPT. Two-way analysis of variance (ANOVA) revealed the results (LMT (b), Stress: F1,31=0.843, P=0.366; MR16-1: F1,31=0.064, P=0.801; interaction: F1,31=0.078, P=0.782), (TST (c), Stress: F1,31=11.351, P=0.002; MR16-1: F1,31=9.425, P=0.005; interaction: F1,31=9.317, P=0.005), (FST (d); Stress: F1,30=15.389, P=0.001; MR16-1: F1,30=4.363, P=0.046; interaction: F1,27=0.008, P=0.929), (SPT (e); Stress: F1,31=6.312, P=0.018; MR16-1: F1,31=7.259, P=0.012; interaction: F1,31=6.002, P=0.021), (SPT (f); Stress: F1,30=5.126, P=0.032; MR16-1: F1,30=5.086, P=0.032; interaction: F1,30=20.956, P<0.001). The values represent the mean±s.e.m. (n=7–9). *P<0.05, **P<0.01, ***P<0.001 compared with the control-treated stress group. (g) Schedule of social defeat stress (10 days), social interaction test and surgery, drug treatment (intracerebroventricular (i.c.v.)), and behavioral tests. (h) LMT. (i) TST. (j) FST. (k) One % SPT. Two-way ANOVA revealed the results (LMT (h), Stress: F1,32=1.406, P=0.245; MR16-1: F1,32=0.091, P=0.765; interaction: F1,32=0.009, P=0.926), (TST (i), Stress: F1,31=12.465, P=0.001; MR16-1: F1,31=0.014, P=0.905; interaction: F1,31=0.391, P=0.537), (FST (j); Stress: F1,31=12.149, P=0.002; MR16-1: F1,31=0.027, P=0.871; interaction: F1,31=0.476, P=0.496), (SPT (k), Stress: F1,31=12.737, P=0.001; MR16-1: F1,31=0.008, P=0.929; interaction: F1,31=0.094, P=0.762). The values represent the mean±s.e.m. (n=8). *P<0.05 and **P<0.01 compared with the control+stressed group. The number in the column is the number of mice. NS, not significant.
Figure 2
Figure 2
Anti-inflammatory effects of MR16-1 in serum and the expression of synaptic proteins in the brain of susceptible mice after social defeat stress. (a) Schedule of social defeat stress (10 days), social interaction test, drug treatment and sample collection. Samples of blood and brain were collected 1 day and 7 days after intravenous (i.v.) injection of MR16-1. Serum levels of tumor necrosis factor (TNF)-α, interleukin (IL)-1β and IL-6 were measured using enzyme-linked immunosorbent assay (ELISA). The levels of PSD-95 and GluA1 in the brain regions were measured using western blot. (bd) Serum levels of TNF-α, IL-1β and IL-6 on day 13 (1 day after injection). Two-way analysis of variance (ANOVA) revealed the results (TNF-α (b), Stress: F1,30=5.541, P=0.026; MR16-1: F1,30=4.608, P=0.041; interaction: F1,30=10.326, P=0.003), (IL-1β (c), Stress: F1,29=9.026, P=0.006; MR16-1: F1,30=7.935, P=0.009; interaction: F1,30=6.938, P=0.014), (IL-6 (d), Stress: F1,30=7.868, P=0.009; MR16-1: F1,30=6.487, P=0.017; interaction: F1,30=7.179, P=0.013). Data are shown as the mean±s.e.m. (n=7 or 8). *P<0.05 and **P<0.01 compared with the control-treated stress group. (eg) Serum levels of TNF-α, IL-1β and IL-6 on day 19 (7 days after injection). Two-way ANOVA revealed the results (TNF-α (e), Stress: F1,47=4.192, P=0.047; MR16-1: F1,47=4.301, P=0.044; interaction: F1,47=4.744, P=0.035), (IL-1β (f), Stress: F1,47=29.068, P<0.001; MR16-1: F1,47=11.296, P=0.002; interaction: F1,47=8.032, P=0.007), (IL-6 (g), Stress: F1,45=4.532, P=0.039; MR16-1: F1,45=0.006, P=0.939; interaction: F1,45=0.405, P=0.528). Data are shown as the mean±s.e.m. (n=12 or 13). *P<0.05, **P<0.01, ***P<0.001 compared with the control-treated stressed group. (h and i) Western blot of PSD-95 and GluA1 in the CA1, CA3 and DG of hippocampus, prefrontal cortex (PFC) and nucleus accumbens (NAc). (h) Two-way ANOVA revealed the results (CA1, Stress: F1,22=3.256, P=0.088; MR16-1: F1,22=1.414, P=0.250; interaction: F1,22=0.536, P=0.474), (CA3, Stress: F1,22=11.880, P=0.003; MR16-1: F1,22=9.458, P=0.006; interaction: F1,22=5.788, P=0.026), (DG, Stress: F1,21=6.180, P=0.023; MR16-1: F1,21=0.599, P=0.449; interaction: F1,21=5.523, P=0.030), (PFC, Stress: F1,22=15.933, P=0.001, MR16-1: F1,22=7.278, P=0.014; interaction: F1,22=4.772, P=0.042), (NAc, Stress: F1,22=26.386, P=0.001; MR16-1: F1,22=4.429, P=0.049; interaction: F1,22=8.705, P=0.008). (i) Two-way ANOVA revealed the results (CA1, Stress: F1,22=1.442, P=0.245; MR16-1: F1,22=0.043, P=0.839; interaction: F1,22=0.220, P=0.645), (CA3, Stress: F1,22=7.600, P=0.013; MR16-1: F1,22=6.257, P=0.022; interaction: F1,22=8.696, P=0.008), (DG, Stress: F1,22=5.075, P=0.037; MR16-1: F1,22=4.731, P=0.043; interaction: F1,22=6.105, P=0.024), (PFC, Stress: F1,22=18.398, P<0.001; MR16-1: F1,22=0.979, P=0.335; interaction: F1,22=4.223, P=0.054), (NAc, Stress: F1,22=5.590, P=0.029; MR16-1: F1,22=7.094, P=0.015; interaction: F1,22=0.293, P=0.595). The values are expressed as percentages relative to those in the control mice. The values represent the mean±s.e.m. (n=5 or 6). *P<0.05, **P<0.01, ***P<0.001 compared with the control-treated stress group. The number in the column is the number of mice. NS, not significant.
Figure 3
Figure 3
Effects of MR16-1 on alterations in the spine density of brain regions of susceptible mice after social defeat stress. (ag) Representative photomicrographs of Golgi-Cox stained pyramidal neurons in the CA1, CA3 and DG of the hippocampus, prelimbic and infralimbic of medial prefrontal cortex (PFC), nucleus accumbens (NAc) shell and NAc core from animals of each group. Scale bar, 10 μm. Two-way analysis of variance (ANOVA) revealed the following results: (CA1 (a), Stress: F1,23=2.949, P=0.101; MR16-1: F1,23=2.215, P=0.152; interaction: F1,23=1.887, P=0.185), (CA3 (b), Stress: F1,23=34.883, P<0.001; MR16-1: F1,23=43.261, P<0.001; interaction: F1,23=52.541, P<0.001), (DG (c), Stress: F1,23=60.089, P<0.001; MR16-1: F1,23=42.512, P<0.001; interaction: F1,23=66.634, P<0.001), (mPFC PrL (d), Stress: F1,23=28.073, P<0.001; MR16-1: F1,23=41.098, P<0.001; interaction: F1,23=28.073, P<0.001), (mPFC IL (e), Stress: F1,23=98.468, P<0.001; MR16-1: F1,23=111.264, P<0.001; interaction: F1,23=124.841, P<0.001), (NAc shell (f), Stress: F1,23=29.435, P<0.001; MR16-1: F1,23=36.049, P<0.001; interaction: F1,23=16.416, P<0.001), (NAc core (g), Stress: F1,23=72.553, P<0.001; MR16-1: F1,23=87.632, P<0.001; interaction: F1,23=87.632, P<0.001). The values represent the mean±s.e.m. (n=6). **P<0.01, ***P<0.001 compared with the control-treated stress group. The number in the column is the number of mice. NS, not significant.
Figure 4
Figure 4
Effects of MR16-1 on alterations in the composition of gut microbiome in phylum of susceptible mice after social defeat stress. (a) Phylum. (b) Levels of Firmicutes. (c) Levels of Bacteroidetes. (d) Ratio of Firmicutes to Bacteroidetes. One-way analysis of variance (ANOVA) revealed the results (Firmicutes (b), F1,14=5.227, P=0.023), (Bacteroidetes (c), F1,14=0.137, P=0.873), (Firmicutes/Bacteroidetes ratio (d); F1,14=3.964, P=0.048). Data are shown as the mean±s.e.m. (n=5). *P<0.05 compared with the control-treated stress group. The number in the column is the number of mice. NS, not significant.
Figure 5
Figure 5
Effects of MR16-1 on alterations in the composition of gut microbiome in genus of susceptible mice after social defeat stress. (a) Genus. (b) Levels of Staphylococcus. (c) Levels of Sutterella. (d) Levels of Butyricicoccus. (e) Levels of Oscillospira. One-way analysis of variance (ANOVA) revealed the results (Staphylococcus (b), F1,14=4.104, P=0.044), (Sutterella (c), F1,14=4.505, P=0.037), (Butyricicoccus (d), F1,14=6.727, P=0.011), (Oscillospira (e), F1,14=9.762, P=0.003). Data are shown as the mean±s.e.m. (n=5). *P<0.05 and **P<0.01 compared with the control-treated stress group. The number in the column is the number of mice. NS, not significant.

References

    1. World Health Organization (WHO). Depression. Fact sheet No. 369/October 2012. Available at http://www.who.int/mediacentre/factsheets/fs369/en/index.html.
    1. Dantzer R, O’Connor JC, Freund GG, Johnson RW, Kelly KW. From inflammation to sickness and depression: when the immune system subjugates the brain. Nature Rev Neurosci 2008; 9: 46–57. - PMC - PubMed
    1. Miller AH, Maletic V, Raison CL. Inflammation and its discontents: the role of cytokines in the pathophysiology of major depression. Biol Psychiatry 2009; 65: 732–741. - PMC - PubMed
    1. Raison CL, Lowry CA, Rook GA. Inflammation, sanitation, and consternation: loss of contact with coevolved, tolerogenic microorganisms and the pathophysiology and treatment of major depression. Arch Gen Psychiatry 2010; 67: 1211–1224. - PMC - PubMed
    1. Hashimoto K. Inflammatory biomarkers as differential predictors of antidepressant response. Int J Mol Sci 2015; 16: 7796–7801. - PMC - PubMed

Publication types

MeSH terms