Inflammation-associated DNA methylation patterns in epithelium of ulcerative colitis
- PMID: 28557546
- PMCID: PMC5687324
- DOI: 10.1080/15592294.2017.1334023
Inflammation-associated DNA methylation patterns in epithelium of ulcerative colitis
Abstract
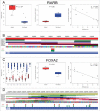
Aberrant DNA methylation patterns have been reported in inflamed tissues and may play a role in disease. We studied DNA methylation and gene expression profiles of purified intestinal epithelial cells from ulcerative colitis patients, comparing inflamed and non-inflamed areas of the colon. We identified 577 differentially methylated sites (false discovery rate <0.2) mapping to 210 genes. From gene expression data from the same epithelial cells, we identified 62 differentially expressed genes with increased expression in the presence of inflammation at prostate cancer susceptibility genes PRAC1 and PRAC2. Four genes showed inverse correlation between methylation and gene expression; ROR1, GXYLT2, FOXA2, and, notably, RARB, a gene previously identified as a tumor suppressor in colorectal adenocarcinoma as well as breast, lung and prostate cancer. We highlight targeted and specific patterns of DNA methylation and gene expression in epithelial cells from inflamed colon, while challenging the importance of epithelial cells in the pathogenesis of chronic inflammation.
Keywords: DNA methylation; inflammatory bowel disease; intestinal epithelial cell; transcriptome; ulcerative colitis.
Figures


Similar articles
-
Decreased Expression of Cystathionine β-Synthase Exacerbates Intestinal Barrier Injury in Ulcerative Colitis.J Crohns Colitis. 2019 Aug 14;13(8):1067-1080. doi: 10.1093/ecco-jcc/jjz027. J Crohns Colitis. 2019. PMID: 30722010
-
Accelerated age-related CpG island methylation in ulcerative colitis.Cancer Res. 2001 May 1;61(9):3573-7. Cancer Res. 2001. PMID: 11325821
-
Aberrant gene methylation in non-neoplastic mucosa as a predictive marker of ulcerative colitis-associated CRC.Oncotarget. 2016 Mar 1;7(9):10322-31. doi: 10.18632/oncotarget.7188. Oncotarget. 2016. PMID: 26862732 Free PMC article.
-
DNA methylation of colon mucosa in ulcerative colitis patients: correlation with inflammatory status.Inflamm Bowel Dis. 2011 Sep;17(9):1955-65. doi: 10.1002/ibd.21573. Epub 2011 Jan 6. Inflamm Bowel Dis. 2011. PMID: 21830274
-
Development, validation and implementation of an in vitro model for the study of metabolic and immune function in normal and inflamed human colonic epithelium.Dan Med J. 2015 Jan;62(1):B4973. Dan Med J. 2015. PMID: 25557335 Review.
Cited by
-
Molecular subtypes based on DNA methylation predict prognosis in colon adenocarcinoma patients.Aging (Albany NY). 2019 Dec 18;11(24):11880-11892. doi: 10.18632/aging.102492. Epub 2019 Dec 18. Aging (Albany NY). 2019. PMID: 31852837 Free PMC article.
-
Inflammatory Bowel Disease and Risk of Colorectal Cancer: An Overview From Pathophysiology to Pharmacological Prevention.Front Pharmacol. 2021 Oct 20;12:772101. doi: 10.3389/fphar.2021.772101. eCollection 2021. Front Pharmacol. 2021. PMID: 34744751 Free PMC article. Review.
-
Early and accurate detection of cholangiocarcinoma in patients with primary sclerosing cholangitis by methylation markers in bile.Hepatology. 2022 Jan;75(1):59-73. doi: 10.1002/hep.32125. Epub 2021 Dec 5. Hepatology. 2022. PMID: 34435693 Free PMC article.
-
Identification of O-glycosylation related genes and subtypes in ulcerative colitis based on machine learning.PLoS One. 2024 Dec 31;19(12):e0311495. doi: 10.1371/journal.pone.0311495. eCollection 2024. PLoS One. 2024. PMID: 39739658 Free PMC article.
-
Molecular disparities in colorectal cancers of White Americans, Alabama African Americans, and Oklahoma American Indians.NPJ Precis Oncol. 2023 Aug 19;7(1):79. doi: 10.1038/s41698-023-00433-5. NPJ Precis Oncol. 2023. PMID: 37598287 Free PMC article.
References
-
- Conrad K, Roggenbuck D, Laass MW. Diagnosis and classification of ulcerative colitis. Autoimmun Rev 2014; 13:463–6; PMID:24424198; https://doi.org/10.1016/j.autrev.2014.01.028 - DOI - PubMed
-
- Laass MW, Roggenbuck D, Conrad K. Diagnosis and classification of Crohn's disease. Autoimmun Rev 13:467–71; PMID:24424189; https://doi.org/10.1016/j.autrev.2014.01.029</bib> - DOI - PubMed
-
- Li Y, Kundu P, Seow SW, de Matos CT, Aronsson L, Chin KC, Kärre K, Pettersson S, Greicius G. Gut microbiota accelerate tumor growth via c-jun and STAT3 phosphorylation in APCMin/+ mice. Carcinogenesis 2012; 33:1231–8; PMID:22461519; https://doi.org/10.1093/carcin/bgs137 - DOI - PubMed
-
- Jostins L, Ripke S, Weersma RK, Duerr RH, McGovern DP, Hui KY, Lee JC, Schumm LP, Sharma Y, Anderson CA, et al. . Host-microbe interactions have shaped the genetic architecture of inflammatory bowel disease. Nature 2012; 491:119–24; PMID:23128233; https://doi.org/10.1038/nature11582 - DOI - PMC - PubMed
-
- Araki A, Kanai T, Ishikura T, Makita S, Uraushihara K, Iiyama R, Totsuka T, Takeda K, Akira S, Watanabe M. MyD88-deficient mice develop severe intestinal inflammation in dextran sodium sulfate colitis. J Gastroenterol 2005; 40:16–23; PMID:15692785; https://doi.org/10.1007/s00535-004-1492-9 - DOI - PubMed
MeSH terms
Substances
Grants and funding
LinkOut - more resources
Full Text Sources
Other Literature Sources
Medical
