

The Road to Language Learning Is Not Entirely Iconic: Iconicity, Neighborhood Density, and Frequency Facilitate Acquisition of Sign Language
- PMID: 28557672
- PMCID: PMC5507709
- DOI: 10.1177/0956797617700498
The Road to Language Learning Is Not Entirely Iconic: Iconicity, Neighborhood Density, and Frequency Facilitate Acquisition of Sign Language
Abstract
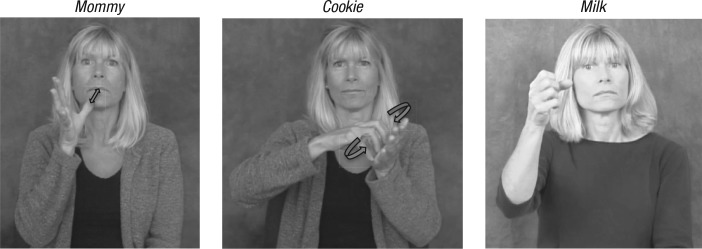
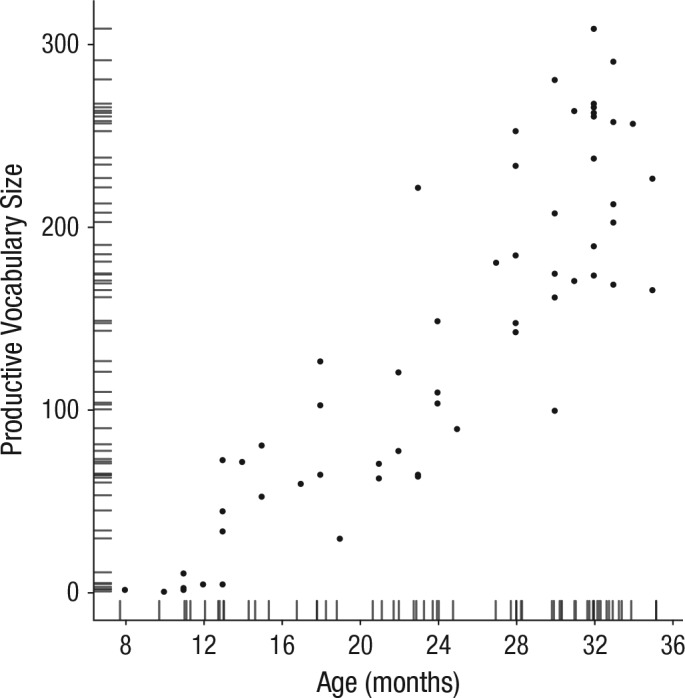
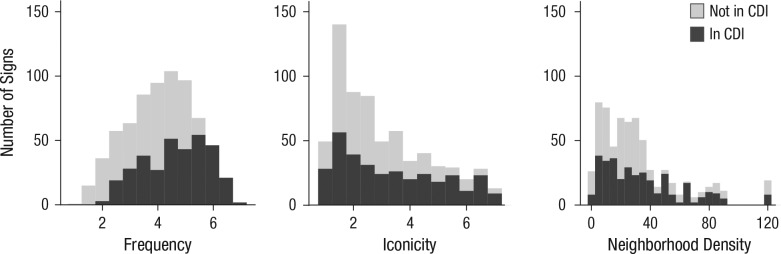
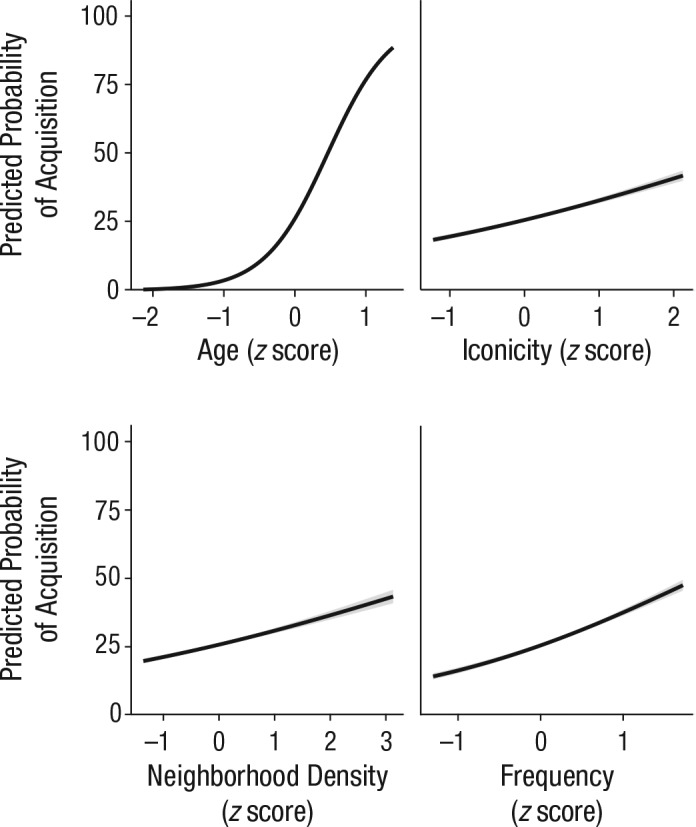
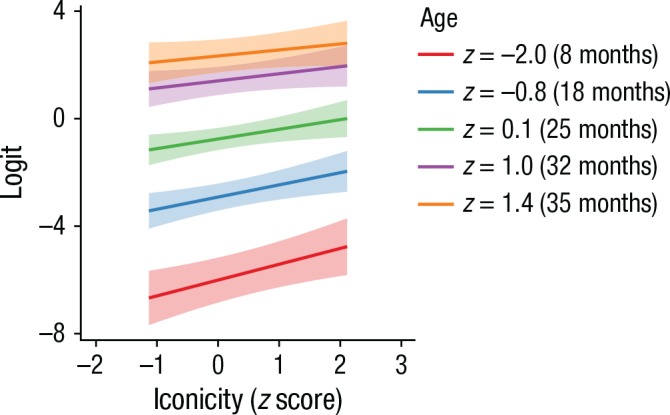
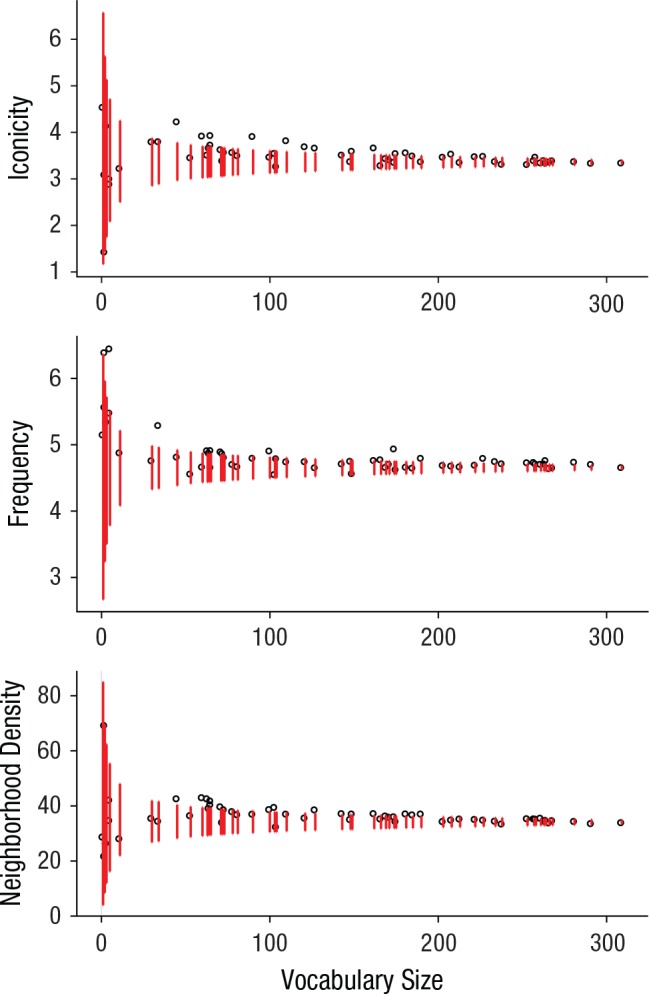
Iconic mappings between words and their meanings are far more prevalent than once estimated and seem to support children's acquisition of new words, spoken or signed. We asked whether iconicity's prevalence in sign language overshadows two other factors known to support the acquisition of spoken vocabulary: neighborhood density (the number of lexical items phonologically similar to the target) and lexical frequency. Using mixed-effects logistic regressions, we reanalyzed 58 parental reports of native-signing deaf children's productive acquisition of 332 signs in American Sign Language (ASL; Anderson & Reilly, 2002) and found that iconicity, neighborhood density, and lexical frequency independently facilitated vocabulary acquisition. Despite differences in iconicity and phonological structure between signed and spoken language, signing children, like children learning a spoken language, track statistical information about lexical items and their phonological properties and leverage this information to expand their vocabulary.
Keywords: frequency; iconicity; open data; phonological neighborhood density; sign language; vocabulary acquisition.
Conflict of interest statement
Figures
References
-
- Anderson D., Reilly J. (2002). The MacArthur Communicative Development Inventory: Normative data for American Sign Language. Journal of Deaf Studies and Deaf Education, 7, 83–106. - PubMed
-
- Baus C., Gutiérrez-Sigut E., Quer J., Carreiras M. (2008). Lexical access in Catalan Signed Language (LSC) production. Cognition, 108, 856–865. - PubMed
-
- Brentari D. (1998). A prosodic model of sign language phonology. Cambridge, MA: MIT Press.
-
- Brown R. (1978). Why are signed languages easier to learn than spoken languages? Part two. Bulletin of the American Academy of Arts and Sciences, 32(3), 25–44.
MeSH terms
Grants and funding
LinkOut - more resources
Full Text Sources
Other Literature Sources
