

Variation in Emergency Department vs Internal Medicine Excess Charges in the United States
- PMID: 28558093
- PMCID: PMC5818801
- DOI: 10.1001/jamainternmed.2017.1598
Variation in Emergency Department vs Internal Medicine Excess Charges in the United States
Abstract
Importance: Uninsured and insured but out-of-network emergency department (ED) patients are often billed hospital chargemaster prices, which exceed amounts typically paid by insurers.
Objective: To examine the variation in excess charges for services provided by emergency medicine and internal medicine physicians.
Design, setting, and participants: Retrospective analysis was conducted of professional fee payment claims made by the Centers for Medicare & Medicaid Services for all services provided to Medicare Part B fee-for-service beneficiaries in calendar year 2013. Data analysis was conducted from January 1 to July 31, 2016.
Main outcomes and measures: Markup ratios for ED and internal medicine professional services, defined as the charges submitted by the hospital divided by the Medicare allowable amount.
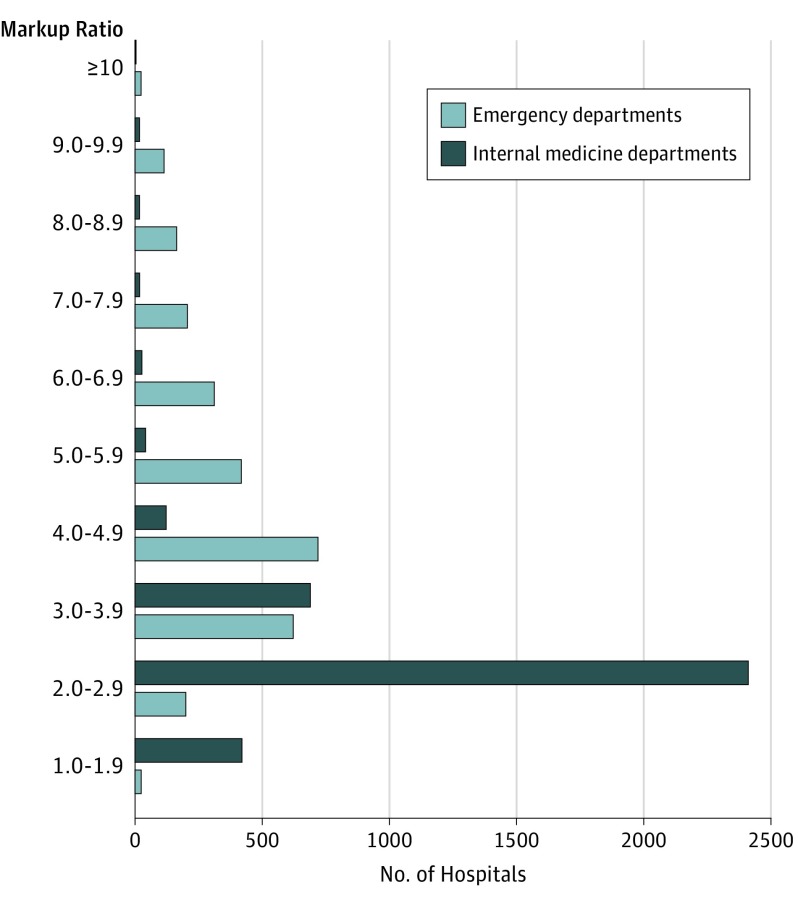
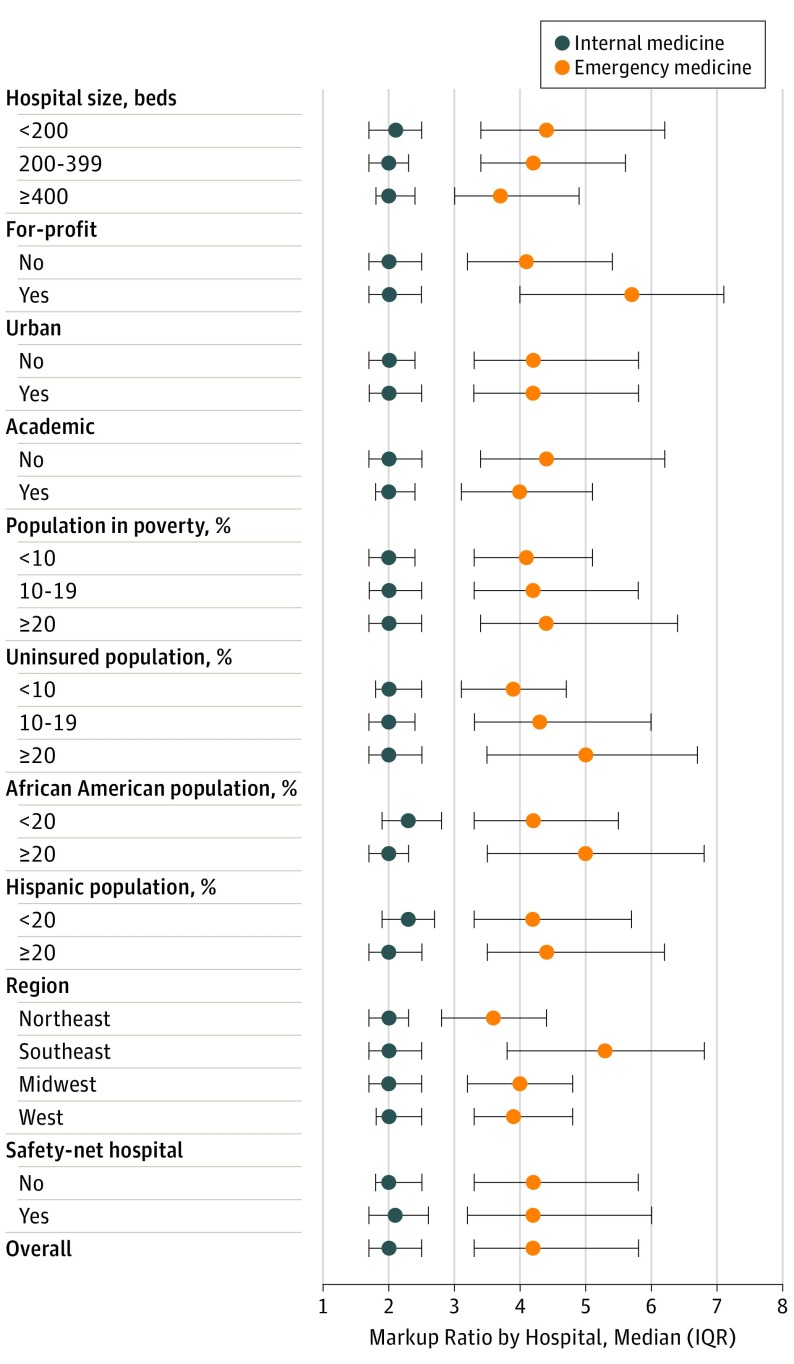
Results: Our analysis included 12 337 emergency medicine physicians from 2707 hospitals and 57 607 internal medicine physicians from 3669 hospitals in all 50 states. Services provided by emergency medicine physicians had an overall markup ratio of 4.4 (340% excess charges), which was greater than the markup ratio of 2.1 (110% excess charges) for all services performed by internal medicine physicians. Markup ratios for all ED services ranged by hospital from 1.0 to 12.6 (median, 4.2; interquartile range [IQR], 3.3-5.8); markup ratios for all internal medicine services ranged by hospital from 1.0 to 14.1 (median, 2.0; IQR, 1.7-2.5). The median markup ratio by hospital for ED evaluation and management procedure codes varied between 4.0 and 5.0. Among the most common ED services, laceration repair had the highest median markup ratio (7.0); emergency medicine physician review of a head computed tomographic scan had the greatest interhospital variation (range, 1.6-27.7). Across hospitals, markups in the ED were often substantially higher than those in the internal medicine department for the same services. Higher ED markup ratios were associated with hospital for-profit ownership (median, 5.7; IQR, 4.0-7.1), a greater percentage of uninsured patients seen (median, 5.0; IQR, 3.5-6.7 for ≥20% uninsured), and location (median, 5.3; IQR, 3.8-6.8 for the southeastern United States).
Conclusions and relevance: Across hospitals, there is wide variation in excess charges on ED services, which are often priced higher than internal medicine services. Our results inform policy efforts to protect uninsured and out-of-network patients from highly variable pricing.
Conflict of interest statement
Figures
Comment in
-
Services Provided by Internal Medicine Physicians Compared With Emergency Physicians: Flawed Data.JAMA Intern Med. 2018 Feb 1;178(2):296-297. doi: 10.1001/jamainternmed.2017.7958. JAMA Intern Med. 2018. PMID: 29404612 No abstract available.
-
Services Provided By Internal Medicine Physicians Compared With Emergency Physicians: Flawed Data-Reply.JAMA Intern Med. 2018 Feb 1;178(2):297. doi: 10.1001/jamainternmed.2017.7966. JAMA Intern Med. 2018. PMID: 29404617 No abstract available.
Similar articles
-
Variation in markups on outpatient oncology services in the United States.Am J Manag Care. 2018 Feb 1;24(2):e59-e60. Am J Manag Care. 2018. PMID: 29461852
-
Association Between Insurance Status and Access to Hospital Care in Emergency Department Disposition.JAMA Intern Med. 2019 May 1;179(5):686-693. doi: 10.1001/jamainternmed.2019.0037. JAMA Intern Med. 2019. PMID: 30933243 Free PMC article.
-
US Hospitals Are Still Using Chargemaster Markups To Maximize Revenues.Health Aff (Millwood). 2016 Sep 1;35(9):1658-64. doi: 10.1377/hlthaff.2016.0093. Health Aff (Millwood). 2016. PMID: 27605648
-
Variations in payment patterns for surgical care in the centers for Medicare and Medicaid Services.Surgery. 2017 Feb;161(2):312-319. doi: 10.1016/j.surg.2015.12.028. Epub 2016 Feb 26. Surgery. 2017. PMID: 26922367 Review.
-
What is an emergency? The judgments of two physicians.Ann Emerg Med. 1994 Apr;23(4):833-40. doi: 10.1016/s0196-0644(94)70322-1. Ann Emerg Med. 1994. PMID: 8161055 Review.
Cited by
-
Postoperative Disparities Facing Patients Experiencing Homelessness: Opportunities for Advocacy From an Anesthesiology Perspective.Cureus. 2025 Aug 11;17(8):e89782. doi: 10.7759/cureus.89782. eCollection 2025 Aug. Cureus. 2025. PMID: 40791211 Free PMC article. Review.
-
Cost variation and revisit rate for adult patients with asthma presenting to the emergency department.Am J Emerg Med. 2022 Nov;61:179-183. doi: 10.1016/j.ajem.2022.09.021. Epub 2022 Sep 16. Am J Emerg Med. 2022. PMID: 36155254 Free PMC article.
-
Engaging Biomedical Engineering in Health Disparities Challenges.J Community Med Health Educ. 2018;8(2):595. doi: 10.4172/2161-0711.1000595. Epub 2018 Mar 5. J Community Med Health Educ. 2018. PMID: 31223515 Free PMC article.
-
Efforts to improve the billing accuracy of robotic-assisted thoracic surgery through education, updated procedure cards, and electronic medical record system changes.BMJ Open Qual. 2024 Apr 22;13(2):e002710. doi: 10.1136/bmjoq-2023-002710. BMJ Open Qual. 2024. PMID: 38649198 Free PMC article.
-
Caesarean section in uninsured women in the USA: systematic review and meta-analysis.BMJ Open. 2019 Mar 3;9(3):e025356. doi: 10.1136/bmjopen-2018-025356. BMJ Open. 2019. PMID: 30833323 Free PMC article.
References
-
- Bai G, Anderson GF. US hospitals are still using chargemaster markups to maximize revenues. Health Aff (Millwood). 2016;35(9):1658-1664. - PubMed
-
- Bai G, Anderson GF. Extreme markup: the fifty US hospitals with the highest charge-to-cost ratios. Health Aff (Millwood). 2015;34(6):922-928. - PubMed
-
- Anderson GF. From “soak the rich” to “soak the poor”: recent trends in hospital pricing. Health Aff (Millwood). 2007;26(3):780-789. - PubMed
Publication types
MeSH terms
LinkOut - more resources
Full Text Sources
Other Literature Sources
