Review
. 2017 Jun 28;117(12):7615-7672.
doi: 10.1021/acs.chemrev.6b00790. Epub 2017 May 30.

X-ray Scattering Studies of Protein Structural Dynamics

Affiliations
Review

X-ray Scattering Studies of Protein Structural Dynamics

Steve P Meisburger et al. Chem Rev. .

Abstract

X-ray scattering is uniquely suited to the study of disordered systems and thus has the potential to provide insight into dynamic processes where diffraction methods fail. In particular, while X-ray crystallography has been a staple of structural biology for more than half a century and will continue to remain so, a major limitation of this technique has been the lack of dynamic information. Solution X-ray scattering has become an invaluable tool in structural and mechanistic studies of biological macromolecules where large conformational changes are involved. Such systems include allosteric enzymes that play key roles in directing metabolic fluxes of biochemical pathways, as well as large, assembly-line type enzymes that synthesize secondary metabolites with pharmaceutical applications. Furthermore, crystallography has the potential to provide information on protein dynamics via the diffuse scattering patterns that are overlaid with Bragg diffraction. Historically, these patterns have been very difficult to interpret, but recent advances in X-ray detection have led to a renewed interest in diffuse scattering analysis as a way to probe correlated motions. Here, we will review X-ray scattering theory and highlight recent advances in scattering-based investigations of protein solutions and crystals, with a particular focus on complex enzymes.


Figures
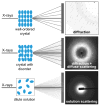
Figure 1
Figure 1
Diffraction, diffuse scattering, and SAXS result from the elastic scattering of X-rays when they interact with electrons. The characteristic patterns they produce on a detector result from interference of the scattered waves, and they reflect the degree of disorder present in the sample. The diffuse scattering image was adapted with permission from Ref. . Copyright 1997 United States National Academy of Sciences.
Figure 2
Figure 2
The aromatic amino acid (AAA) biosynthetic pathway of plants and microorganisms is tightly regulated. The many regulated enzymes (black dotted lines) all share a common trait in that they are located at junction points within the pathway. All three AAAs originate from chorismate, synthesized via the shikimate pathway (blue). Phenylalanine and tyrosine are then formed from a branching pathway that begins with chorismate mutase (orange), while tryptophan is synthesized from a pathway beginning with anthranilate synthase (green).
Figure 3
Figure 3
SEC-SAXS studies reveal that TmaDAHP synthase is regulated by Tyr, an end-product of the AAA biosynthetic pathway, via the dimerization of ACT domains (blue domains in insets). (A) The experimental scattering of TmaDAHP synthase in the absence of tyrosine was fitted via CRYSOL to the crystal structure of the ligand-free enzyme in an open state (inset, PDB: 1RZM) and found to be in close agreement. (B) Conversely, TmaDAHP synthase in the presence of Tyr was found to be better modeled by the Tyr-bound closed state (inset, PDB: 3PG9). In both plots, experimental data are in black, the theoretical profile of the open state is in blue, and the theoretical profile of the closed state is in orange. Adapted with permission from Ref. . Copyright 2011 American Society for Biochemistry and Molecular Biology.
Figure 4
Figure 4
SEC-SAXS studies show that allosteric regulation by Tyr can be conferred by fusing the ACT domain of TmaDAHP synthase to the normally unregulated P. furiosa enzyme. Addition of Tyr to this chimeric construct leads to a change in scattering (green to pink), indicative of a structural change. The experimental scattering in the presence of Tyr is in close agreement to the theoretical profile calculated in CRYSOL from the crystal structure of the Tyr-bound construct in the closed state (inset, PDB: 4GRS). Adapted with permission from Ref. . Copyright 2013 United States National Academy of Sciences.
Figure 5
Figure 5
SEC-SAXS studies reveal that the product of CM, prephenate, causes a tighter association between the DAHP synthase and CM domains of the DAHP synthase-CM fusion protein of Geobacillus sp. This subtle compaction is best seen in the Kratky plot, where the main peak shifts to the right (blue to red) in the presence of prephenate (red line). Adapted with permission from Ref. . Copyright 2016 American Society for Biochemistry and Molecular Biology.
Figure 6
Figure 6
The three AAAs are directed to the formation of important neurotransmitters in mammals, and the pterin-dependent hydroxylase enzymes are allosterically regulated via ACT domains.
Figure 7
Figure 7
The full-length crystal structure of rat PheH reveals a homotetramer in an inactive state. In this crystal structure, the ACT domains (orange) are too far apart to interact (PDB: 5DEN).
Figure 8
Figure 8
PheH undergoes a cooperative structural change upon addition of the allosteric activator, Phe. (A) Titration of 0–1 mM Phe to rat PheH leads to a change in the mid-q region in the Kratky plots (red to blue). (B) Singular value decomposition of this titration dataset reveals that this structural change is a cooperative two-state transition. Adapted with permission from Ref. . Copyright 2016 American Chemical Society.
Figure 9
Figure 9
SEC-SAXS coupled with EFA allows for structural modeling of the PheH tetramer. (A) The elution profile of PheH (black) was separated via EFA into two sequential, overlapping peaks (blue and red). (B) These peaks were found to have scattering profiles indicative of aggregation (blue) and the PheH tetramer (red). (C) Rigid-body models generated from the EFA-separated scattering profiles indicate that the allosteric activation of PheH is consistent with the ACT domains (orange) rotating to dimerize with diagonal partners. Adapted with permission from Ref. . Copyright 2016 American Chemical Society.
Figure 10
Figure 10
ATCase catalyzes the first step in the biosynthetic pathway of the pyrimidines CTP and UTP. The enzyme is activated by the purine ATP and allosterically inhibited by CTP and UTP acting in tandem.
Figure 11
Figure 11
Crystal structures of ATCase reveal two major conformations. (A) In the presence of the inhibitor CTP or in the absence of ligands, ATCase preferentially forms a closed heterododecamer of two catalytic trimers (blue) and three regulatory dimers (orange) known as the tense or T-state (PDB: 6AT1). (B) Upon addition of the substrate analog PALA, ATCase instead forms a relaxed R-state (PDB: 1D09). The PALA-bound structure involves rotation of both the regulatory dimers and the catalytic trimers, leading to an elongated and open structure relative to the T-state.
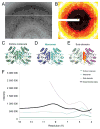
Figure 12
Figure 12
SAXS reveals that ATCase undergoes a concerted transition between T and R-states that reaches saturation at substoichiometric concentrations of PALA. (A) Titration of PALA (purple to yellow) causes the subsidiary maximum to shift to lower q, indicative of a transition to a more open structure. Clear iso-scattering points suggest a two-state transition from the closed T-state to the open R-state. (B) SVD reveals that R-state saturation occurs before all available active sites are PALA bound, indicative of cooperative binding leading to an increased PALA binding affinity. Adapted with permission from Ref. . Copyright 1997 International Union of Crystallography. http://journals.iucr.org
Figure 13
Figure 13
SAXS studies of a hybrid ATCase provide evidence for concerted cooperativity. (A) ATCase with wild-type catalytic domains (blue spheres) undergoes a visible change in scattering profile between the ligand-free T-state (red curve) and PALA-bound R-state (blue curve). (B) A mutant ATCase consisting of mutant catalytic domains (brown spheres) incapable of binding substrate showed no difference between the ligand-free and PALA-present scattering profiles. (C) Addition of PALA to a hybrid ATCase with five mutant catalytic domains (brown spheres) and a single wild-type domain (blue sphere) leads to a change in scattering similar to that seen for the wild-type enzyme, indicating that only a single functional catalytic domain is necessary to cause the hybrid ATCase to shift from T- to R-state. Adapted with permission from Ref. . Copyright 2001 Macmillan Publishers Ltd: Nature.
Figure 14
Figure 14
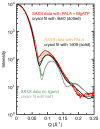
Discrepancies between SAXS and crystallography have left open questions about the interpretation of the ATCase R-state structure. The scattering of ligand-free ATCase (green curve) agrees well with a theoretical profile of the ligand-free crystal structure (grey curve, PDB: 6AT1). However, the scattering of ATCase with PALA (orange curve) or with PALA and Mg2+-ATP (red curve) do not overlay with theoretical profiles of crystal structures with PALA-bound (black solid, PDB: 1D09) or with PALA and Mg2+-ATP bound (black dotted, PDB: 4KH0). As noted by Svergun, this discrepancy is likely due to an R-state more open in solution than in a crystal. Adapted with permission from Ref. . Copyright 2001 Elsevier.
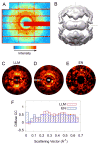
Figure 15
Figure 15
Time-resolved SAXS studies provide insight into the kinetics of the ATCase transition. (A) A time series of SAXS patterns of ATCase with substrate at 5 °C captures the change in conformation at 38 ms (open circles), 380 ms (open squares), and 3800 ms (filled circles) after mixing. The long dashed curve (filled squares) is a linear combination of 33% T-state and 67% R-state. (B) Integrated scattering intensities plotted as a function of time indicate a rapid, initial transition from T- to R-state after mixing of Asp with ATCase and CP, reaching a steady-state phase with majority of the population in the R-state from 0.5–1.5 s. The population then reverts to the T-state after 1.5 s as substrates are exhausted. Adapted with permission from Ref. . Copyright 2008 Elsevier.
Figure 16
Figure 16
Ribonucleotide reductase (RNR) is located at a critical junction in nucleotide metabolism and is tightly regulated by various nucleotide effectors. Class I RNRs act on ribonucleoside diphosphates. The pathway products dTTP, dGTP, and dATP at low concentration act as specificity effectors by increasing the affinity for specific substrates. ATP and dATP at high concentrations act as activity effectors, increasing and decreasing catalytic turnover, respectively.
Figure 17
Figure 17
Class Ia RNRs can form a variety of active and inhibited oligomers. (A) The α dimer of E. coli RNR contains the active site as well as allosteric sites. The activity site is located in the N-terminal ATP-cone domain (orange), which plays a role in higher order oligomerization (PDB: 3R1R). (B) The β dimer of E. coli RNR initiates radical chemistry via a diferric metallocofactor (red spheres) (PDB: 1RIB). (C) A low-resolution model of the active E. coli RNR depicts an α2β2 complex in which the subunits are docked along their symmetry axes.,, (D) E. coli RNR forms an inhibited α4β4 complex in the presence of saturating concentrations of dATP. (E) Under crowding conditions, E. coli RNR forms concatenated α4β4 rings. (F) Human RNR forms an α6 ring in the presence of dATP, precluding interaction with the β2 dimer (PDB: 5D1Y). (G) P. aeruginosa RNR forms an inactive α4 ring in the presence of dATP. The enzyme contains two sequential ATP-cone domains: one that is deficient in dATP-binding (red) and an N-terminal copy that can bind two dATP molecules (orange) (PDB: 5IM3).
Figure 18
Figure 18
SAXS titration studies of E. coli RNR show that a large, non-globular oligomer with 1:1 subunit stoichiometry forms at inhibiting levels of dATP. (A) The Kratky representation of 0 μM (blue), 12 μM (orange), and 40 μM (red) dATP titrated into a 6 μM solution of α2 and β2 in the presence of CDP. As [dATP] increases, the Kratky plot shifts from a single dominant peak to a double-humped curve characteristic of a non-globular structure. (B) Titration of 0–30 μM α2 (violet to yellow) in a solution of 6 μM β2 and saturating dATP and CDP reveals a maximum Rg value at the equimolar point (dotted line), indicative of 1:1 subunit stoichiometry in the inhibited complex. Adapted with permission from Ref. . Copyright 2011 United States National Academy of Sciences.
Figure 19
Figure 19
SAXS studies of a trapped radical mutant of E. coli RNR reveal an active α2β2 complex that is kinetically stabilized even under strongly inhibiting conditions. (A) An unnatural amino tyrosine (NH2Y730) leads to a radical trap at this position in the α subunit. Mixing this mutant α with β lacking a radical leads to a Kratky plot reminiscent of an inhibited α4β4 species at high protein concentrations (red). By contrast, mixing the mutant α and β with an intact radical leads to a Kratky plot with a single dominant peak, indicative of an active α2β2 species even at high protein concentrations (blue). (B) A time-course over 22 minutes (yellow to blue) of the mutant RNR in the presence of inhibiting levels of dATP displays a gradual shift from a monomodal to a bimodal Kratky curve, consistent with a remarkably slow conversion from α2β2 to the inhibited α4β4. Adapted with permission from Ref. . Copyright 2013 United States National Academy of Sciences.
Figure 20
Figure 20
Initiation and elongation processes in a minimal Type I PKS. (A) Mechanism of loading of starter and extender units to PKS modules. The CoA-linked starter or extender unit is first covalently attached to the AT domain, with the CoA acting as the leaving group. (B) The starter unit is transferred to the Ppant arm (only the terminal thiol is shown) of the initiation module’s ACP domain and then transferred to the KS domain of the first extension module, where it is covalently attached via a thioester bond. Extender units are transferred to the Ppant arm of the ACP domain in the same module. The now loaded substrate is then transferred to the subsequent module’s KS domain in a similar manner. (C) Mechanism of the carbon-carbon bond-forming reaction between the already attached individual units.
Figure 21
Figure 21
Overall organization of the DEBS pathway, which produces 6-deoxyerythronolide B (dEB), and constructs studied by SEC-SAXS. (A) The pathway contains a loading (LD) didomain, 6 extension modules (M1 – M6), and a cyclizing thioesterase (TE) domain. DEBS modules are organized into three distinct complexes, DEBS1, DEBS2 and DEBS3. Each complex is homodimeric, and each chain contains two different modules. (B) Domain composition of the major constructs described in this review, namely module 3 (M3), the minimal M3 + TE construct, and DEBS3 (a bimodule of M5 and M6).,
Figure 22
Figure 22
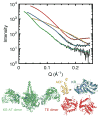
SEC-SAXS studies of DEBS components show agreement with crystal structures. (Top) Solution scattering profiles (black) of individual DEBS domains compared to CRYSOL fits from the existing crystal structures. The fits shown include the KS-AT didomain (green), ACP domain (yellow), KR domain (cyan), and TE domain (red). (Bottom) Ribbon diagrams of the crystal structures (PDB codes 2JU2, 2FR0, 1MO2 and 2QQ3) corresponding to the CRYSOL fits. Adapted with permission from Ref. . Copyright 2014 Elsevier.
Figure 23
Figure 23
SEC-SAXS experiments enable rigid-body modeling of a DEBS module and comparison to a cryo-EM structure of a similar module. (A) SAXS-derived model of the minimal DEBS M3 + TE construct derived by treating the individual domain crystal structures shown in Figure 3 as rigid bodies. (B) SAXS model for DEBS M3, created in a similar manner. (C) The EM model of PikAIII module 5 (M5) displays a notably different architecture. (D) Experimental SAXS data of DEBS M3 shown as Kratky plots. Theoretical profile of the SAXS-derived DEBS M3 model (blue) provides a better fit than the PikAIII EM model (pink). Adapted with permission from Ref. . Copyright 2014 Elsevier.
Figure 24
Figure 24
SEC-SAXS enables rigid-body modeling of a full bimodular complex, DEBS3. (A) Experimental scattering of the DEBS3 bimodule model (black) was used to generate rigid-body models. The theoretical scattering from a representative structure obtained through rigid-body modeling is shown in blue. (B) Rigid-body model of DEBS3 generated from the crystal structures shown in Figure 3. Adapted with permission from Ref. . Copyright 2014 Elsevier.
Figure 25
Figure 25
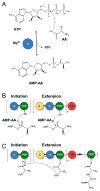
Initiation and elongation processes in a minimal NRPS. (A) The amino acid to be incorporated is first activated by the A domain using one molecule of ATP to form an amino acid-AMP adduct (AMP-AA). (B) The activated starter unit is covalently linked through a thioester bond to the initiation module’s PCP domain. Extender units are loaded onto their respective modules in the same way as the starter unit. (C) Mechanism of the amide bond-forming reaction between individual units.
Figure 26
Figure 26
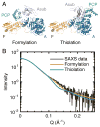
SAXS experiments provide evidence for a linear arrangement of the F and A domains in the NRPS module, LrgA. (A) Crystal structures of the formylation and thiolation states of LgrA, with the individual domains colored as follows: PCP (green), F (yellow), A (blue), and the A subdomain (lavender). In both structures, the F and A domains adopt the extended conformation. (B) The theoretical scattering of the formylation and thiolation states both show good agreement to the experimental data at low q. Adapted with permission from Ref. . Copyright 2016 Macmillan Publishers Ltd: Nature.
Figure 27
Figure 27
Diffuse scattering from insulin. (A) A 40-hour still diffraction image of insulin collected on X-ray film. Bragg reflections are overexposed. The sharp arcs are artifacts from the beamline setup. (B) Bragg reflections and haloes digitally separated by subtracting the smoothly varying diffuse scattering component of the data. Inset: Rotationally symmetric Compton and water scattering. (C) Variational scattering evaluated from difference between (A) and two components in (B). Adapted with permission from Ref. . Copyright 1988 Macmillan Publishers Ltd: Nature.
Figure 28
Figure 28
Diffuse scattering from yeast tRNA crystals reveals lattice-coupled motions as well as intramolecular motions. (A) Simulated scattering from anisotropic lattice-coupled motions agrees well with the experimentally observed diffuse streaks between Bragg peaks. (B) The cloudy diffuse scattering (see arrows) in the experimental data can be well described a model for short-range correlated motions of the anticodon arm. Adapted with permission from Ref. . Copyright 1994 International Union of Crystallography. http://journals.iucr.org
Figure 29
Figure 29
Diffuse scattering streaks indicate lattice disorder in orthorhombic lysozyme crystals. (A) Still diffraction image recorded on X-ray film shows diffuse streaks between Bragg reflections along the reciprocal lattice planes perpendicular to a* and c*. (B) Simulation of the diffuse scattering produced by small correlated displacements of pairs of molecules along a and c axes in the crystal lattice reproduces the streaked features. Adapted with permission from Ref. . Copyright 1987 Publishers Ltd: Nature.
Figure 30
Figure 30
Diffuse scattering from tetragonal and triclinic lysozyme crystals collected on X-ray film (left) compared with simulated scattering from LLM models (right). Top: Still diffraction image from triclinic lysozyme compared with LLM model. Middle and bottom: Still diffraction images from tetragonal lysozyme separated by a 90 degree rotation compared with simulated scattering from the LLM model. Adapted with permission from Ref. . Copyright 1992 John Wiley & Sons, Inc.
Figure 31
Figure 31
Diffuse scattering from tetragonal lysozyme is compared with simulated scattering from TLS refinement. (A) Still diffraction image collected on an image-plate detector. (B) Simulated scattering taking into account both rigid-body rotation and translation achieved satisfactory agreement. Adapted with permission from Ref . Copyright 1996 International Union of Crystallography. http://journals.iucr.org
Figure 32
Figure 32
(A) Experimental diffuse scattering from orthorhombic lysozyme compared with diffuse scattering patterns calculated from (B) NM analysis and (C) MD simulations. Adapted with permission from Ref. . Copyright 1994 Macmillan Publishers Ltd: Nature.
Figure 33
Figure 33
Diffuse scattering from SNase is attributed to LLM. (A) Raw diffraction image from SNase crystal. (B) Diffraction image after polarization correction, solid angle normalization, and mode filtering to remove Bragg peaks. (C) 3D diffuse map. (D) Mercator projections of the experimental diffuse patterns are compared with simulated scattering from best-fit LLM model. Adapted from Ref. . Copyright 1997 United States National Academy of Sciences.
Figure 34
Figure 34
Comparison of diffuse scattering from SNase with MD simulations. (A) Scatter plot of structures extracted from the MD trajectory projected on the first two principal components of the C-alpha position covariance matrix. (B) Comparison of isotropic diffuse intensity for experimental data (red) and MD model (blue). (C) Isosurface in the experimental map ( D0) where positive intensity is shown in green and negative intensity is in red. (D) Isosurface of simulated map from the MD model ( Dmd). (E) Difference intensity map ( D0-Dmd). The (F) experimental and (G) simulated anisotropic scattering in the 0.27Å−1 resolution shell, where there is the best agreement between the two. Adapted with permission from Ref. . Copyright 2014 United States National Academy of Sciences.
Figure 35
Figure 35
Diffuse scattering from crystals of calmodulin were used to infer motions via LLM. (A) Still diffraction image of calmodulin reveals streaked features in the solvent ring (inset) as well as broader large-scale diffuse scattering in the background. (B) Simulated scattering using an anisotropic LLM model reproduces the experimental scattering. The isosurface streaks in (C) the data and (D) simulation show good agreement. Adapted with permission from Ref. . Copyright 1997 Elsevier.
Figure 36
Figure 36
Glycerophosphodiesterase (GpdQ) is an example where collective motions inferred from TLS refinement do not agree with the diffuse scattering. (A) A still diffraction image from GpdQ shows significant diffuse scattering. (B) Mode-filtered GpdQ diffraction image. (C)–(E) TLS refinements were performed with treating either the dimer (shown in C), the monomer (shown in D), or each subdomain (shown in E) as separate rigid bodies. (F) Radial diffuse intensity profiles for experimental and simulated GpdQ data. None of the TLS-derived ensembles showed significant agreement with the experimental data. Adapted with permission from Ref. . Copyright 2015 International Union of Crystallography. http://journals.iucr.org
Figure 37
Figure 37
The diffuse scattering of CypA was compared with three models of motion. (A) Mode-filtered diffraction image. (B) The data from individual images are combined and symmetrized to yield a nearly complete 3D diffuse map. (C) Simulated diffraction images for CypA obtained with LLM model. (D) Integrated 3D diffuse data. (E) Simulated diffraction images for CypA obtained with an EN model. Lighter colors correspond to stronger intensity. (F) Linear correlation coefficients (CCs) between diffuse scattering data and LLM (red) or EN models (blue) computed by resolution shell for CypA. Adapted with permission from Ref. . Copyright 2016 United States National Academy of Sciences.
Figure 38
Figure 38
Geometric frustration. Two conformations, A and B, prefer to be neighbors as AB rather than AA or BB. (a) The constraints can be satisfied on a square lattice. (b) The constraints cannot be satisfied on a triangular lattice. The minimum energy configuration shows correlated disorder.
Figure 39
Figure 39
Geometric frustration in a crystal of the N-terminal fragment of the FFV Gag protein leads to unusual diffuse scattering features. (A) Zooming into a diffraction image shows the diffuse circular features that occur in the vicinity of the Bragg peaks. (B) Reciprocal lattice sections normal to c. (C)–(D) Simulating the scattering from the Ising model (shown in C) leads to a pattern (shown in D) that can explain the experimental data. Adapted with permission from Ref. . Copyright 2011 International Union of Crystallography. http://journals.iucr.org
Figure 40
Figure 40
Acoustic vibrations contribute to the diffuse scattering of 70S ribosome crystals. (A) Still diffraction image of 70S ribosome from T. thermophilus. (B) The diffraction image after processing to subtract the circularly symmetric background and reduce noise by binning. The pattern shows mm symmetry (C) Unbinned but fully-processed data from the section of the image shown in (B). Ridges of intensity parallel to c* are visible. (D) Simulated scattering using an acoustic vibration model. (E) Standard deviation of the intensity vs. scattering angle predicted for acoustic vibrations (solid line) and motions without long-ranged correlations (dashed line). (F) Standard deviation of the experimentally measured diffuse intensity vs. scattering angle (solid line) follows follows the same quantity simulated using the acoustic vibration model with the measured Bragg intensities (dashed line). Adapted with permission from Ref. . Copyright 2015 International Union of Crystallography. http://journals.iucr.org
Figure 41
Figure 41
Photosystem II (PSII). (A) Packing of PSII in the crystal lattice (bc plane), PDB ID: 5E7C. (B) Orientation of PSII dimer in the thylakoid membrane (axis of symmetry indicated by a dashed line). (C) Key cofactors involved in the water-splitting reaction, drawn in the same orientation as the left side of the dimer in part (B). Red arrows show the path of electron transport.
Figure 42
Figure 42
Serial crystallography reveals diffuse scattering extending beyond the Bragg diffraction limit of PSII. (A) A still diffraction pattern of a PSII microcrystal shows diffuse scattering beyond the resolution of the Bragg peaks. (B) Speckle patterns are clearly observed extending past the 4.5-Å resolution of Bragg diffraction (white circle) in a 2D slice through the diffraction volume. (C) The 3D diffraction volume assembled by merging 2,848 still images. (D) Projection of the 3D autocorrelation, the Fourier transform of the continuous diffraction intensities, along a crystal axis. (E)–(F) The equivalent projections of the autocorrelation functions calculated from the model of the PSII dimer (shown in E) agrees better with the experimentally derived autocorrelation than the monomer (shown in F). Adapted with permission from Ref. . Copyright 2016 Macmillan Publishers Ltd: Nature.

References

    1. Wall ME, Ealick SE, Gruner SM. Three-dimensional diffuse X-ray scattering from crystals of Staphylococcal nuclease. Proc Natl Acad Sci U S A. 1997;94:6180–6184. - PMC - PubMed
    1. Svergun D, Barberato C, Koch MHJ. CRYSOL – a program to evaluate X-ray solution scattering of biological macromolecules from atomic coordinates. J Appl Crystallogr. 1995;28:768–773.
    1. Caspar DLD, Clarage J, Salunke DM, Clarage M. Liquid-like movements in crystalline insulin. Nature. 1988;332:659–662. - PubMed
    1. Wall ME, Adams PD, Fraser JS, Sauter NK. Diffuse X-ray scattering to model protein motions. Structure. 2014;22:182–184. - PMC - PubMed
    1. Moore PB. On the relationship between diffraction patterns and motions in macro-molecular crystals. Structure. 2009;17:1307–1315. - PubMed

LinkOut - more resources