. 2017 Jun 27;33(25):6342-6352.
doi: 10.1021/acs.langmuir.7b00527. Epub 2017 Jun 13.

Buffers Strongly Modulate Fibrin Self-Assembly into Fibrous Networks

Affiliations

Buffers Strongly Modulate Fibrin Self-Assembly into Fibrous Networks

Nicholas A Kurniawan et al. Langmuir. .

Abstract

Fibrin is a plasma protein with a central role in blood clotting and wound repair. Upon vascular injury, fibrin forms resilient fibrillar networks (clots) via a multistep self-assembly process, from monomers, to double-stranded protofibrils, to a branched network of thick fibers. In vitro, fibrin self-assembly is sensitive to physicochemical conditions like the solution pH and ionic strength, which tune the strength of the noncovalent driving forces. Here we report a surprising finding that the buffer-which is necessary to control the pH and is typically considered to be inert-also significantly influences fibrin self-assembly. We show by confocal microscopy and quantitative light scattering that various common buffering agents have no effect on the initial assembly of fibrin monomers into protofibrils but strongly hamper the subsequent lateral association of protofibrils into thicker fibers. We further find that the structural changes are independent of the molecular structure of the buffering agents as well as of the activation mechanism and even occur in fibrin networks formed from platelet-poor plasma. This buffer-mediated decrease in protofibril bundling results in a marked reduction in the permeability of fibrin networks but only weakly influences the elastic modulus of fibrin networks, providing a useful tuning parameter to independently control the elastic properties and the permeability of fibrin networks. Our work raises the possibility that fibrin assembly in vivo may be regulated by variations in the acute-phase levels of bicarbonate and phosphate, which act as physiological buffering agents of blood pH. Moreover, our findings add a new example of buffer-induced effects on biomolecular self-assembly to recent findings for a range of proteins and lipids.


Conflict of interest statement

The authors declare no competing financial interest.

Figures
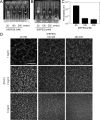
Figure 1
Figure 1
Fibrin networks formed at different HEPES concentrations. (A) Fibrinogen at a concentration of 3 mg/mL was polymerized by addition of 0.5 U/mL thrombin at 37 °C in sealed cuvettes of 1 cm path length with 20, 100, and 200 mM HEPES. (B) After 2 h polymerization, the cuvettes were turned upside down to confirm gelation. Control sample contained 3 mg/mL fibrinogen monomers without thrombin and remained liquid throughout the experiment. (C) Permeability of 3 mg/mL fibrin networks formed with different HEPES concentrations. Data are mean ± standard deviation (n = 3). (D) Confocal fluorescence images of fibrin networks formed at different fibrinogen (1–6 mg/mL) and HEPES (20–200 mM) concentrations, showing that HEPES strongly affects the fiber thickness and network mesh size. Images are maximum intensity projections from z stacks of 20 μm with 0.5 μm z interval, starting 25 μm from the coverslip to minimize any edge effects. Scale bar 10 μm.
Figure 2
Figure 2
Influence of HEPES on fibrin network formation. (A) Schematic of the process of fibrin network formation, starting with conversion of fibrinogen to activated fibrin monomers by release of FpA, which drives the spontaneous assembly into double-stranded fibrin protofibrils, followed by release of FpB and lateral association of protofibrils into fibers that form fibrin networks. Schematic shows the rod-like shape of fibrin monomers with a trinodular arrangement of distal D-domains and a central E-domain (blue circles) and long, flexible αC-appendages that contribute to protofibril bundling protruding from the D-domains. (B and C) Kinetic analysis of thrombin’s enzymatic activity in HEPES buffers of different concentrations (20, 100, or 200 mM). Amount of released (B) FpA and (C) FpB, normalized to the maximum amount for each condition, is plotted as a function of incubation time (symbols). Data are mean ± standard deviation (n = 2). Solid lines show fits to a kinetic model. Fit parameters (kA and kB) are listed in Table 1. (D) Kinetics of protofibril formation and lateral association at different HEPES concentrations, as measured by the solution turbidity (τ) at a wavelength of 350 nm, for fibrin samples at 0.03 mg/mL fibrinogen concentration. (E) Average number of protofibrils per fiber cross-section, N (and the corresponding average fiber mass–length ratio, μ), after 2 h of polymerization, as measured using turbidimetry. Data are mean ± standard deviation (n ≥ 3).
Figure 3
Figure 3
Rheology of fibrin networks formed with different HEPES concentrations. (A) Linear elastic shear modulus, G′, of 1 mg/mL (squares), 3 mg/mL (circles), and 6 mg/mL (triangles) fibrin samples is plotted against HEPES concentration. There are no significant differences across samples with different HEPES concentrations (p > 0.05). Lines connecting symbols are to guide the eye. Data are mean ± s.d. (n ≥ 3). (B) Strength of bundling between protofibrils within the fibrin fibers as a function of HEPES and fibrin concentration was quantified as the parameter x by interpreting the measured G′ in terms of a model that represents fibrin fibers as bundles of N protofibrils, with N measured by turbidimetry. In all cases, x is close to the limit of tight bundling (x = 2; solid line) and far from the limit of loose bundling (x = 1; dashed line). Mean x values (±s.d.) averaged over data at different fibrin concentrations are indicated with short horizontal lines (p > 0.05).
Figure 4
Figure 4
Strain-stiffening behavior of fibrin networks formed at different fibrin and HEPES concentrations. The differential elastic modulus, K′, was measured using a prestress protocol and plotted against the applied prestress, σ, for 1 (circles), 3 (squares), and 6 mg/mL (triangles) fibrin samples formed with (A) 20 (blue), (B) 100 (green), and (C) 200 mM (red) HEPES. (D–F) To reveal the force–extension behavior of the individual protofibrils, data were rescaled by the protofibril density, ρpf (total protofibril length per volume). Observed collapse of the curves at forces above 10 pN independent of HEPES (and fibrin) concentration indicates that HEPES does not alter the intrinsic force–extension behavior of the protofibrils.
Figure 5
Figure 5
Influence of HEPES on ancrod-induced fibrin network formation. (A–C) Confocal fluorescence images of 3 mg/mL fibrin networks formed at 20 , 100, and 200 mM HEPES concentrations. Images are maximum intensity projections from z stacks of 20 μm with 0.5 μm interval. Scale bar 10 μm.
Figure 6
Figure 6
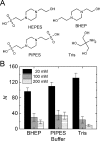
Effect of different buffering agents on fibrin self-assembly. (A) To check whether the suppression of protofibril bundling is specific to HEPES, we also formed fibrin networks in BHEP, PIPES, and Tris buffers, which differ in molecular structure as shown. (B) Average bundle size N in 3 mg/mL fibrin networks is evaluated via turbidimetry in these buffers at 20, 100, or 200 mM final concentrations.
Figure 7
Figure 7
Confocal reflectance images of platelet-poor plasma (PPP) clots formed from porcine blood in the presence of different HEPES (20–200 mM) concentrations, showing that HEPES also decreases the fibrin fiber thickness in the presence of a complex mixture of plasma components. Images are maximum intensity projections from z stacks of 25 μm with 1 μm interval, starting 40 μm from the coverslip to minimize any edge effects. Scale bar 20 μm.

Similar articles

  • Fibrin self-assembly is adapted to oxidation.
    Rosenfeld MA, Bychkova AV, Shchegolikhin AN, Leonova VB, Kostanova EA, Biryukova MI, Sultimova NB, Konstantinova ML. Rosenfeld MA, et al. Free Radic Biol Med. 2016 Jun;95:55-64. doi: 10.1016/j.freeradbiomed.2016.03.005. Epub 2016 Mar 9. Free Radic Biol Med. 2016. PMID: 26969792
  • Assembly of fibrin. A light scattering study.
    Hantgan RR, Hermans J. Hantgan RR, et al. J Biol Chem. 1979 Nov 25;254(22):11272-81. J Biol Chem. 1979. PMID: 500644
  • Does topology drive fiber polymerization?
    Huang L, Hsiao JP, Powierza C, Taylor RM 2nd, Lord ST. Huang L, et al. Biochemistry. 2014 Dec 16;53(49):7824-34. doi: 10.1021/bi500986z. Epub 2014 Dec 5. Biochemistry. 2014. PMID: 25419972 Free PMC article.
  • Fibrinogen and fibrin.
    Weisel JW. Weisel JW. Adv Protein Chem. 2005;70:247-99. doi: 10.1016/S0065-3233(05)70008-5. Adv Protein Chem. 2005. PMID: 15837518 Review.
  • Thrombin generation and fibrin clot structure.
    Wolberg AS. Wolberg AS. Blood Rev. 2007 May;21(3):131-42. doi: 10.1016/j.blre.2006.11.001. Epub 2007 Jan 8. Blood Rev. 2007. PMID: 17208341 Review.

Cited by

References

    1. Weisel J. W.; Litvinov R. I. Mechanisms of fibrin polymerization and clinical implications. Blood 2013, 121 (10), 1712–1719. 10.1182/blood-2012-09-306639. - DOI - PMC - PubMed
    1. Janmey P. A.; Winer J. P.; Weisel J. W. Fibrin gels and their clinical and bioengineering applications. J. R. Soc., Interface 2009, 6 (30), 1–10. 10.1098/rsif.2008.0327. - DOI - PMC - PubMed
    1. Laurens N.; Koolwijk P.; de Maat M. P. Fibrin structure and wound healing. J. Thromb. Haemostasis 2006, 4 (5), 932–939. 10.1111/j.1538-7836.2006.01861.x. - DOI - PubMed
    1. Albala D. M. Fibrin sealants in clinical practice. Cardiovasc. Surg. 2003, 11 (Suppl 1), 5–11. 10.1016/S0967-2109(03)00065-6. - DOI - PubMed
    1. Rousou J. A. Use of fibrin sealants in cardiovascular surgery: A systematic review. J. Card. Surg. 2013, 28 (3), 238–247. 10.1111/jocs.12099. - DOI - PubMed

Publication types