. 2017 May 30;18(1):282.
doi: 10.1186/s12859-017-1682-0.

Numerical integration methods and layout improvements in the context of dynamic RNA visualization

Affiliations

Numerical integration methods and layout improvements in the context of dynamic RNA visualization

Boris Shabash et al. BMC Bioinformatics. .

Abstract

Background: RNA visualization software tools have traditionally presented a static visualization of RNA molecules with limited ability for users to interact with the resulting image once it is complete. Only a few tools allowed for dynamic structures. One such tool is jViz.RNA. Currently, jViz.RNA employs a unique method for the creation of the RNA molecule layout by mapping the RNA nucleotides into vertexes in a graph, which we call the detailed graph, and then utilizes a Newtonian mechanics inspired system of forces to calculate a layout for the RNA molecule. The work presented here focuses on improvements to jViz.RNA that allow the drawing of RNA secondary structures according to common drawing conventions, as well as dramatic run-time performance improvements. This is done first by presenting an alternative method for mapping the RNA molecule into a graph, which we call the compressed graph, and then employing advanced numerical integration methods for the compressed graph representation.

Results: Comparing the compressed graph and detailed graph implementations, we find that the compressed graph produces results more consistent with RNA drawing conventions. However, we also find that employing the compressed graph method requires a more sophisticated initial layout to produce visualizations that would require minimal user interference. Comparing the two numerical integration methods demonstrates the higher stability of the Backward Euler method, and its resulting ability to handle much larger time steps, a high priority feature for any software which entails user interaction.

Conclusion: The work in this manuscript presents the preferred use of compressed graphs to detailed ones, as well as the advantages of employing the Backward Euler method over the Forward Euler method. These improvements produce more stable as well as visually aesthetic representations of the RNA secondary structures. The results presented demonstrate that both the compressed graph representation, as well as the Backward Euler integrator, greatly enhance the run-time performance and usability. The newest iteration of jViz.RNA is available at https://jviz.cs.sfu.ca/download/download.html .

Keywords: Graph layout; Numerical integration; RNA; Visualization.


Figures
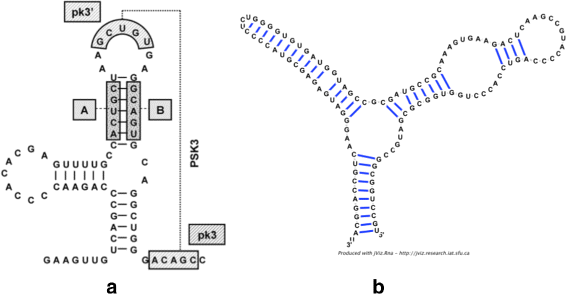
Fig. 1
Fig. 1
The visualization differences observed in jViz.RNA compared to an RNA image which highlights RNA visualization norms in literature. a The Yellow Fever Virus 3’ Untranslated Region (UTR). Image taken from [39] and used with permission, (b) An example produced by jViz.RNA of the S. cervisiae 5s ribosomal RNA (rRNA) (accession X67579)
Fig. 2
Fig. 2
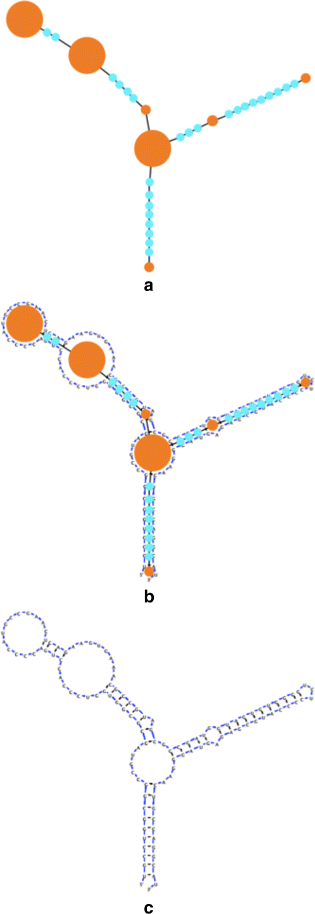
The compressed graph mapped to an RNA structure. a The main RNA elements are compressed into vertexes where each vertex represents an RNA loop element, or a stem base pair. b The nucleotides belonging to each RNA element are drawn on top of the underlying RNA compressed graph. c The resulting RNA representation contains less vertexes than there are nucleotides (in this case 120 nucleotides versus 34 vertexes), and a more familiar visual layout
Fig. 3
Fig. 3
The initial vertex layout process demonstrated using a sample theoretical RNA molecule. l 1, l 2, l 3, l 4, l 5, and l 6 represent loops while b 1, b 2, b 3, b 4, b 5, b 6, and b 7 represent base pairs. The loops and base pair vertexes are connected via black edges. a The RNA nucleotides are first laid out in a circle. b Each set of nucleotides has its average position calculated, and the vertex corresponding to that set is placed in that average position. Following this step, the iterative process of stabilization begins
Fig. 4
Fig. 4
The visualization result obtained for the 248 nt RNA (RNA STRAND ID PDB_00985). a The visualization obtained with jViz’s detailed graph representation (employing the Forward Euler method). b The visualization obtained with jViz’s compressed graph representation and the Forward Euler method. c The visualization obtained with jViz’s compressed graph representation and the Backward Euler method
Fig. 5
Fig. 5
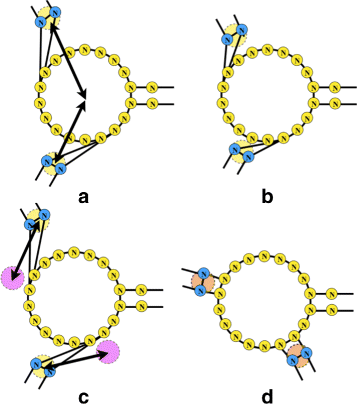
Implementing the ideal position attraction forces causes the stems to align with their ideal layout. a Originally, attraction forces were acting between base pairs, and the loops, attracting the centres of the vertexes directly. b The resulting layout contained artefacts of distorted stems, since base-pairs were unaware of their positions relative to loops. c The idealized attraction forces employ the ideal positions (purple circles) of the stems to attract the base-pair vertexes. d The resulting layout when employing the ideal positions is aware of the position stems should take relative to their parent loops
Fig. 6
Fig. 6
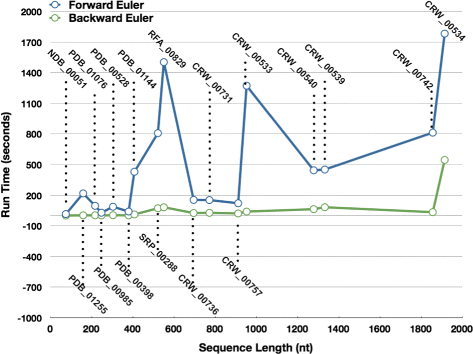
The Run-times (expressed in seconds) of jViz.RNA’s compressed graph representations employing both the Forward and Backward Euler methods
Fig. 7
Fig. 7
The Run-times (expressed in log 10(seconds)) of jViz.RNA’s compressed graph representations employing both the Forward and Backward Euler methods
Fig. 8
Fig. 8
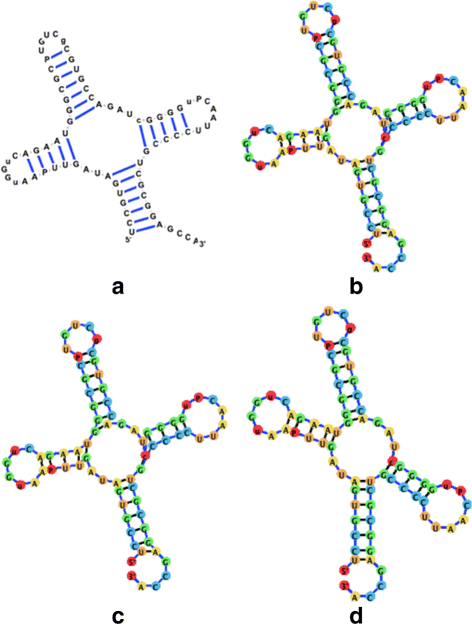
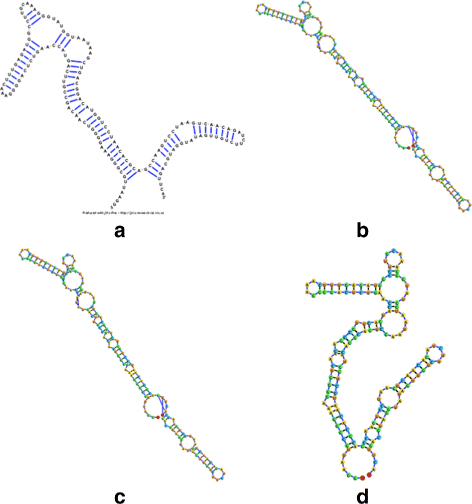
The visualization result obtained for the 75 nt RNA (RNA STRAND ID NDB_00051) utilizing: a The detailed graph representation (employing the Forward Euler method). b The compressed graph representation and the Forward Euler method. c The compressed graph representation and the Backward Euler method. d The compressed graph representation and the Backward Euler method while employing ideal positions attraction forces
Fig. 9
Fig. 9
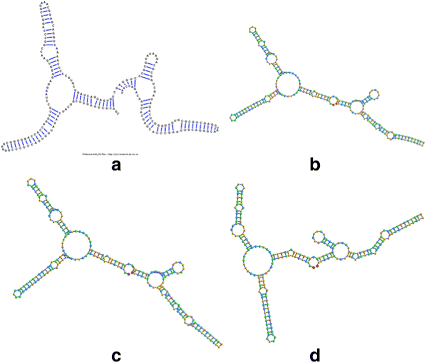
The visualization result obtained for the 159 nt RNA (RNA STRAND ID PDB_01255) utilizing: a The detailed graph representation (employing the Forward Euler method). b The compressed graph representation and the Forward Euler method. c The compressed graph representation and the Backward Euler method. d The compressed graph representation and the Backward Euler method while employing ideal positions attraction forces
Fig. 10
Fig. 10
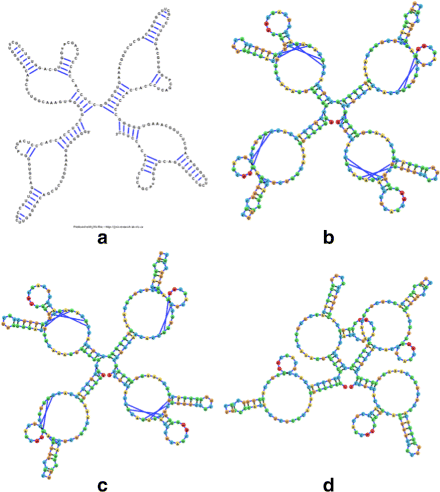
The visualization result obtained for the 217 nt RNA (RNA STRAND ID PDB_01076) utilizing: a The detailed graph representation (employing the Forward Euler method. b The compressed graph representation and the Forward Euler method. c The compressed graph representation and the Backward Euler method. d The compressed graph representation and the Backward Euler method while employing ideal positions attraction forces
Fig. 11
Fig. 11
The visualization result obtained for the 248 nt RNA (RNA STRAND ID PDB_00985) utilizing: a The detailed graph representation (employing the Forward Euler method). b The compressed graph representation and the Forward Euler method. c The compressed graph representation and the Backward Euler method. d The compressed graph representation and the Backward Euler method while employing ideal positions attraction forces
Fig. 12
Fig. 12
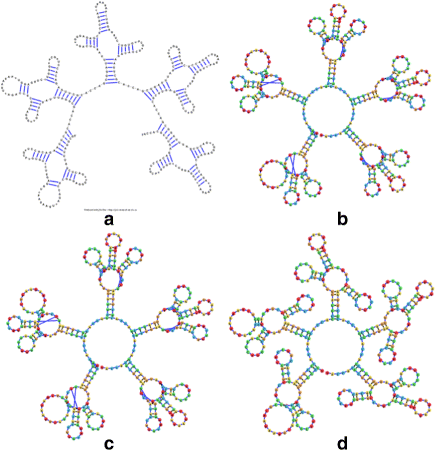
The visualization result obtained for the 304 nt RNA (RNA STRAND ID PDB_00528) utilizing: a The detailed graph representation (employing the Forward Euler method). b The compressed graph representation and the Forward Euler method. c The compressed graph representation and the Backward Euler method. d The compressed graph representation and the Backward Euler method while employing ideal positions attraction forces
Fig. 13
Fig. 13
The visualization result obtained for the 380 nt RNA (RNA STRAND ID PDB_00398) utilizing: a The detailed graph representation (employing the Forward Euler method). b The compressed graph representation and the Forward Euler method. c The compressed graph representation and the Backward Euler method. d The compressed graph representation and the Backward Euler method while employing ideal positions attraction forces
Fig. 14
Fig. 14
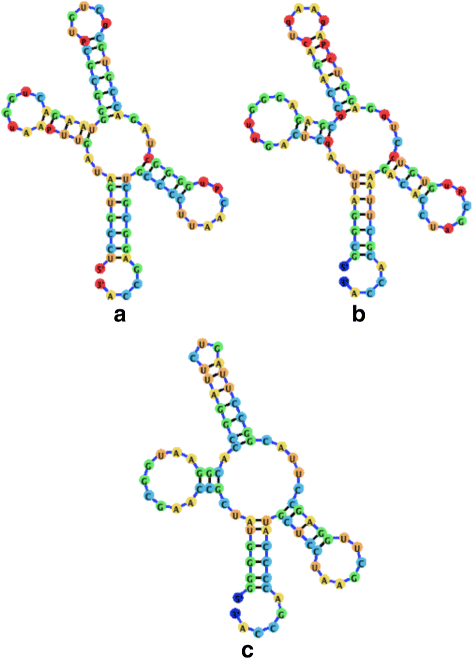
A visualization comparison of tRNA molecules employing the Backward Euler method and the ideal positions attraction forces. a The visualization for a Yeast tRNA utilizing jViz.RNA (RNA STRAND ID: NDB_00051, PDB ID: 1VTQ). b The visualization for a Yeast tRNA utilizing jViz.RNA (RNA STRAND ID: PDB_00045, PDB ID: 1EHZ). c The visualization for an E.coli tRNA utilizing jViz.RNA (RNA STRAND ID: PDB_00426, NDB ID: 1GTS)

Similar articles

Cited by

References

    1. Rietveld K, Poelgeest RV, Pleij A, Boom JHV, Bosch L. The tRNA-like structure at the 3’ terminus of turnip yellow mosaic virus RNA. Differences and similarities with canonical tRNA. Nucleic Acids Res. 1982;10(6):1929–46. doi: 10.1093/nar/10.6.1929. - DOI - PMC - PubMed
    1. Joshi RL, Joshi S, Chapeville F, Haenni AL. tRNA-like structures of plant viral RNAs: conformational requirements for adenylation and aminoacylation. EMBO J. 1983;2(7):1123–27. - PMC - PubMed
    1. Rietveld K, Pleij CWA, Bosch L. Three-dimensional models of the tRNA-like 3’ termini of some plant viral RNAs. EMBO J. 1983;2(7):1079–85. - PMC - PubMed
    1. Rao ALN, Dreher TW, Marsh LE, Hall TC. Proceedings of the National Academy of Science of the United States of America, vol. 86. Washington: National Academy of Sciences; 1989. Telomeric function of the tRNA-like structure of brome mosaic virus RNA. - PMC - PubMed
    1. Matsuda D, Dreher TW. The tRNA-like structure of Turnip yellow mosaic virus RNA is a 3’-translational enhancer. Virology. 2003;321:36–46. doi: 10.1016/j.virol.2003.10.023. - DOI - PubMed

LinkOut - more resources