The development and use of a molecular model for soybean maturity groups
- PMID: 28558691
- PMCID: PMC5450301
- DOI: 10.1186/s12870-017-1040-4
The development and use of a molecular model for soybean maturity groups
Abstract
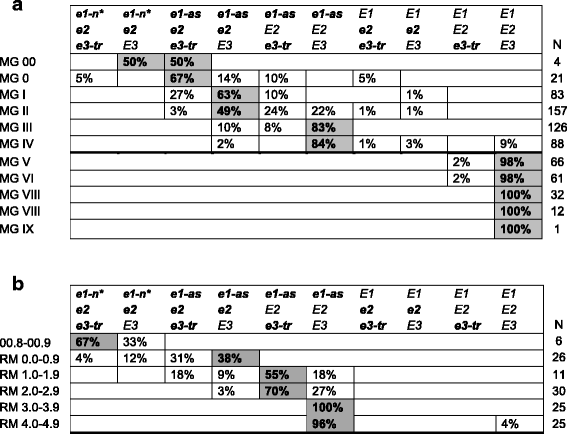
Background: Achieving appropriate maturity in a target environment is essential to maximizing crop yield potential. In soybean [Glycine max (L.) Merr.], the time to maturity is largely dependent on developmental response to dark periods. Once the critical photoperiod is reached, flowering is initiated and reproductive development proceeds. Therefore, soybean adaptation has been attributed to genetic changes and natural or artificial selection to optimize plant development in specific, narrow latitudinal ranges. In North America, these regions have been classified into twelve maturity groups (MG), with lower MG being shorter season than higher MG. Growing soybean lines not adapted to a particular environment typically results in poor growth and significant yield reductions. The objective of this study was to develop a molecular model for soybean maturity based on the alleles underlying the major maturity loci: E1, E2, and E3.
Results: We determined the allelic variation and diversity of the E maturity genes in a large collection of soybean landraces, North American ancestors, Chinese cultivars, North American cultivars or expired Plant Variety Protection lines, and private-company lines. The E gene status of accessions in the USDA Soybean Germplasm Collection with SoySNP50K Beadchip data was also predicted. We determined the E allelic combinations needed to adapt soybean to different MGs in the United States (US) and discovered a strong signal of selection for E genotypes released in North America, particularly the US and Canada.
Conclusions: The E gene maturity model proposed will enable plant breeders to more effectively transfer traits into different MGs and increase the overall efficiency of soybean breeding in the US and Canada. The powerful yet simple selection strategy for increasing soybean breeding efficiency can be used alone or to directly enhance genomic prediction/selection schemes. The results also revealed previously unrecognized aspects of artificial selection in soybean imposed by soybean breeders based on geography that highlights the need for plant breeding that is optimized for specific environments.
Keywords: E genes; Glycine max; Maturity group; Soybean.
Figures


References
-
- Scott W, Aldrich S. Modern soybean production. Champaign: S & A Publications; 1970.
-
- Zhang L, Kyei-Boagen S, Zhang J, Zhang M, Freeland T, Watson C Jr. Modifications of optimum adaptation zones for soybean maturity groups in the USA. Crop Manag. 2007;6
-
- Bernard RL. Two major genes for time of flowering and maturity in soybeans. Crop Sci. 1971;11:242–244. doi: 10.2135/cropsci1971.0011183X001100020022x. - DOI
-
- Buzzell RI. Inheritance of a soybean flowering response to fluorescent-daylength conditions. Can J Genet Cytol. 1971;13:703–707.
-
- Buzzell RI, Voldeng HD. Inheritance of insensitivity to long daylength. Soybean Genet Newslett. 1980;7:26–29.
Publication types
MeSH terms
LinkOut - more resources
Full Text Sources
Other Literature Sources

