

Is Ep-CAM Expression a Diagnostic and Prognostic Biomarker for Colorectal Cancer? A Systematic Meta-Analysis
- PMID: 28558958
- PMCID: PMC5478257
- DOI: 10.1016/j.ebiom.2017.05.025
Is Ep-CAM Expression a Diagnostic and Prognostic Biomarker for Colorectal Cancer? A Systematic Meta-Analysis
Abstract
Background: Cancer stem cell (CSC) epithelial cell adhesion molecule (Ep-CAM) is frequently expressed in colorectal cancer (CRC). However, the clinical significance of Ep-CAM expression in CRC is not clear. This study evaluated whether Ep-CAM provided valuable insight as a molecular biomarker for CRC diagnosis and prognosis and the potential of Ep-CAM as a novel therapeutic target in CRC.
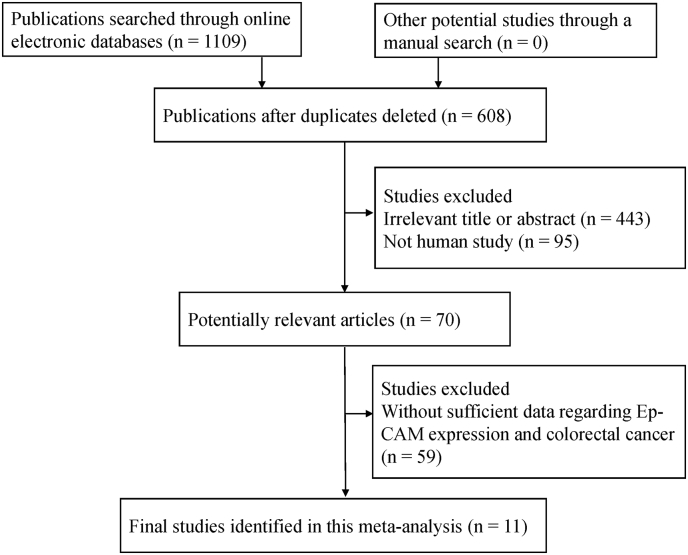
Methods: Publications were selected online using electronic databases. The pooled odds ratios (ORs) or hazard ratios (HRs) with their 95% confidence intervals (95% CIs), and the combined sensitivity, specificity, and area under the curve (AUC) were calculated and summarized.
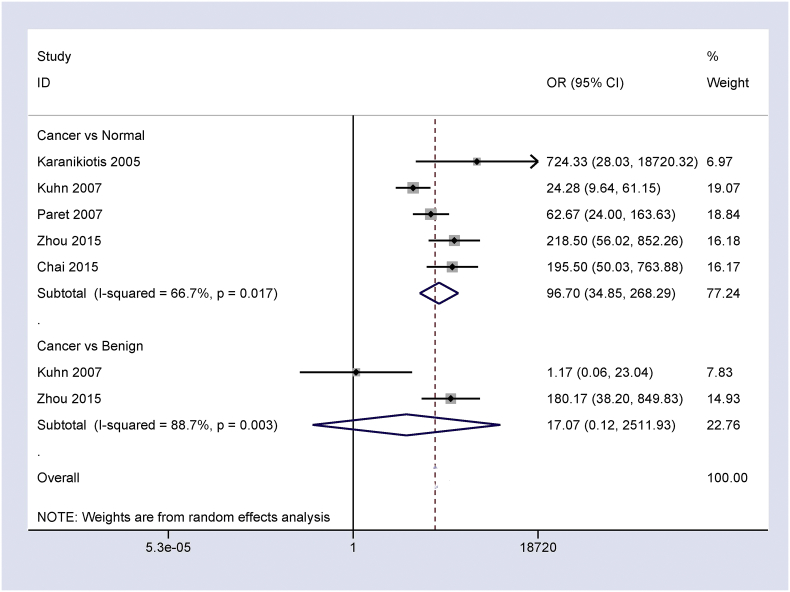
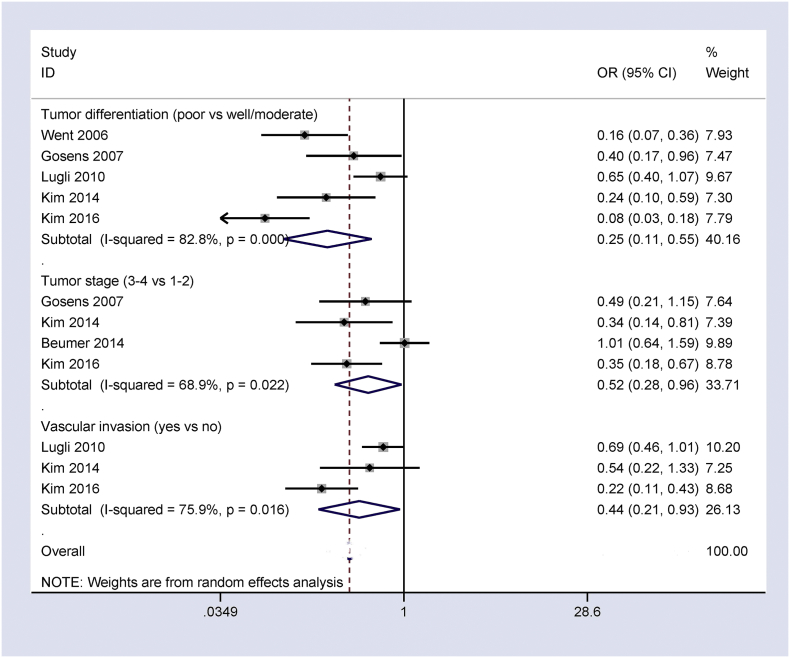
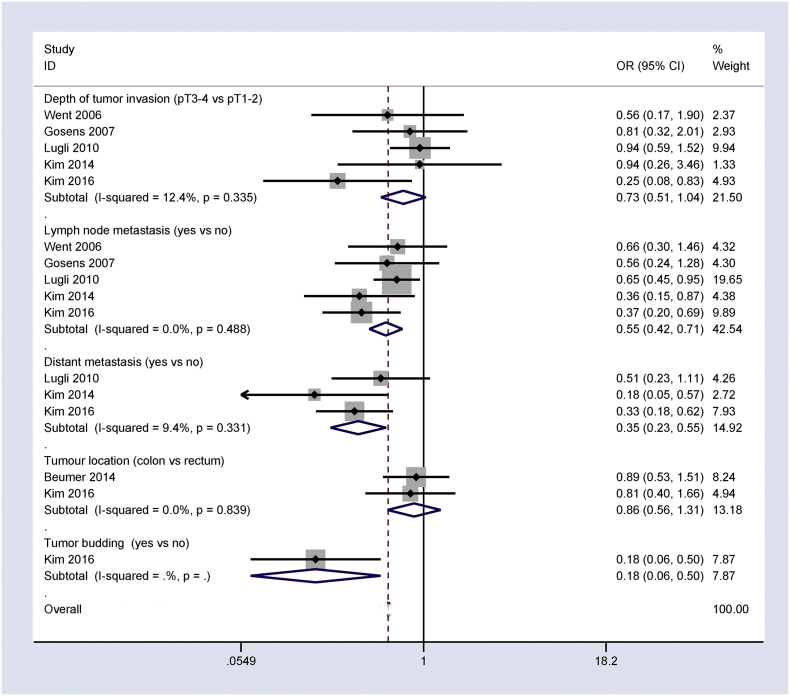
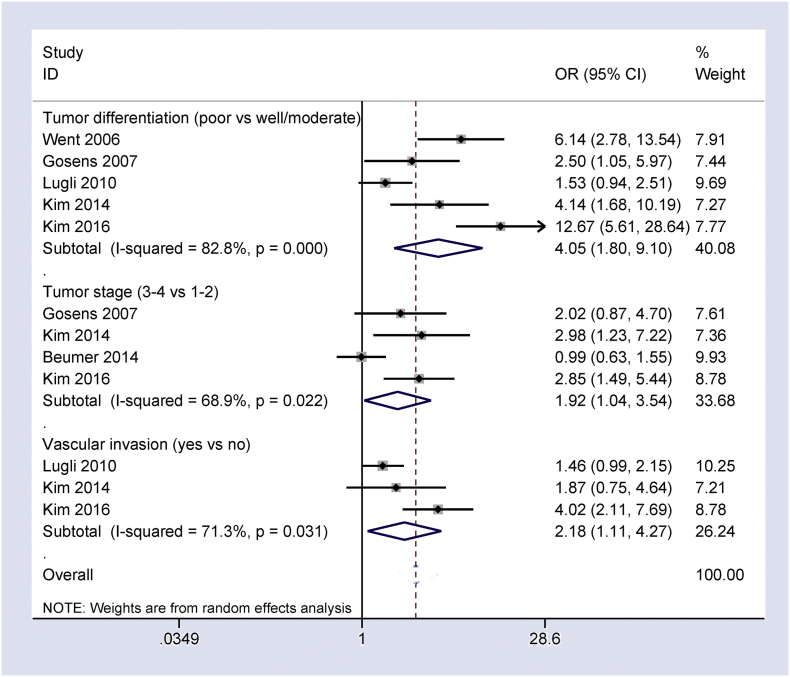
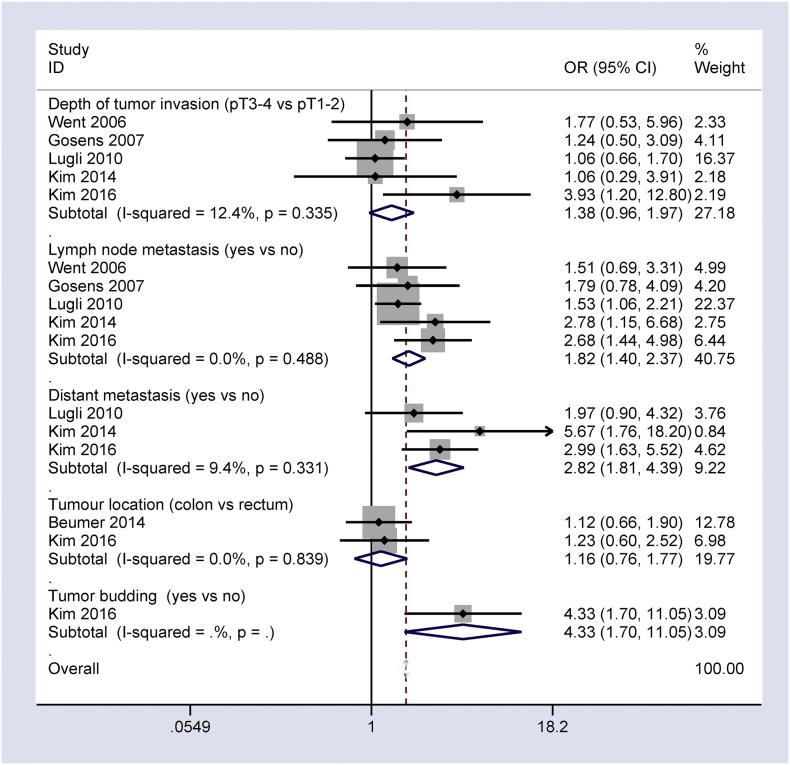
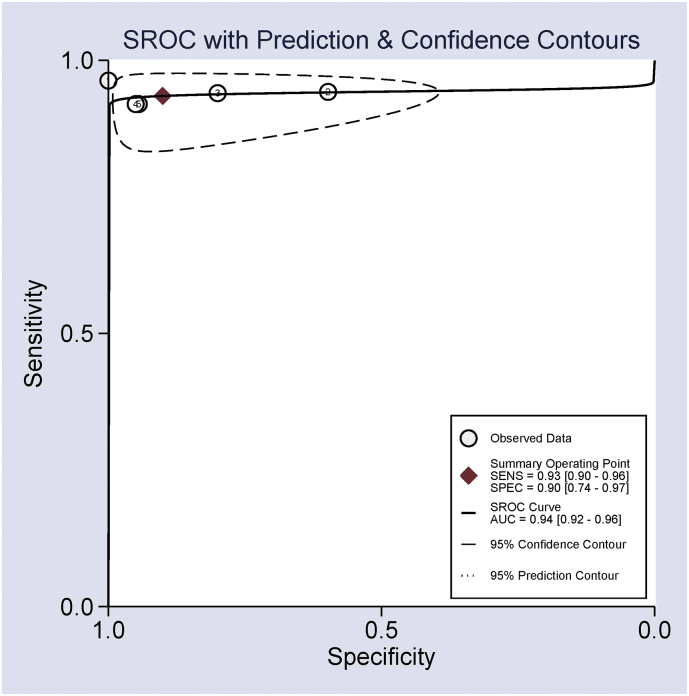
Results: Eleven eligible articles published in English involving 4561 cases were analyzed in this study. Ep-CAM expression was significantly higher in CRC compared with normal controls, and its overexpression was negatively linked to tumor differentiation, tumor stage, vascular invasion, depth of tumor invasion, lymph node metastasis, distant metastasis, and tumor budding in CRC patients. The loss of Ep-CAM expression positively correlated with these characteristics. Multivariate analysis of loss of Ep-CAM expression correlated with a poor prognosis in disease-free survival (DFS), disease-specific survival (DSS), and overall survival (OS). The pooled sensitivity, specificity and AUC values of Ep-CAM expression in patients with CRC vs. normal controls were 0.93, 0.90, and 0.94, respectively.
Conclusions: The present findings suggest that Ep-CAM expression may be associated with CRC carcinogenesis, while the loss of Ep-CAM expression is correlated with the progression, metastasis, and poor prognosis of CRC. Ep-CAM expression may be a useful biomarker for the clinical diagnosis of CRC.
Keywords: Biomarker; CRC; Diagnosis; Ep-CAM; Expression; Prognosis.
Copyright © 2017. Published by Elsevier B.V.
Figures
References
-
- Balzar M., Winter M.J., De Boer C.J., Litvinov S.V. The biology of the 17-1A antigen (Ep-CAM) J. Mol. Med. (Berl.) 1999;77:699–712. - PubMed
-
- Battista M.J., Cotarelo C., Jakobi S., Steetskamp J., Makris G., Sicking I., Weyer V., Schmidt M. Overexpression of epithelial cell adhesion molecule protein is associated with favorable prognosis in an unselected cohort of ovarian cancer patients. J. Cancer Res. Clin. Oncol. 2014;140:1097–1102. - PMC - PubMed
-
- Chai X.B., Song R.F., Xu F. Expression changes in epithelial cell adhesion molecule during colorectal cancer tumorigenesis. Genet. Mol. Res. 2015;14:7624–7629. - PubMed
Publication types
MeSH terms
Substances
LinkOut - more resources
Full Text Sources
Other Literature Sources
Medical
Miscellaneous
