. 2017 Jun 27;114(26):6788-6793.
doi: 10.1073/pnas.1703593114. Epub 2017 May 30.

Synchrony affects Taylor's law in theory and data

Affiliations

Synchrony affects Taylor's law in theory and data

Daniel C Reuman et al. Proc Natl Acad Sci U S A. .

Abstract

Taylor's law (TL) is a widely observed empirical pattern that relates the variances to the means of groups of nonnegative measurements via an approximate power law: variance ga [Formula: see text] mean gb , where g indexes the group of measurements. When each group of measurements is distributed in space, the exponent b of this power law is conjectured to reflect aggregation in the spatial distribution. TL has had practical application in many areas since its initial demonstrations for the population density of spatially distributed species in population ecology. Another widely observed aspect of populations is spatial synchrony, which is the tendency for time series of population densities measured in different locations to be correlated through time. Recent studies showed that patterns of population synchrony are changing, possibly as a consequence of climate change. We use mathematical, numerical, and empirical approaches to show that synchrony affects the validity and parameters of TL. Greater synchrony typically decreases the exponent b of TL. Synchrony influenced TL in essentially all of our analytic, numerical, randomization-based, and empirical examples. Given the near ubiquity of synchrony in nature, it seems likely that synchrony influences the exponent of TL widely in ecologically and economically important systems.

Keywords: Moran effect; aphid; correlation; fluctuation scaling; mean variance scaling.


Conflict of interest statement

The authors declare no conflict of interest.

Figures

Fig. 1.
Fig. 1.
Effects of spatial synchrony on spatial TL for a model with populations identically distributed in different sampling locations and iid through time at each location. Examples use (A) Poisson (λ = 5) and (B) gamma (shape α = 8, rate β = 2) distributions (SI Appendix, S3 shows the parameterization of the gamma distribution). (Top) m is spatial sample mean and v is spatial sample variance. Confirming TL visually, approximately linear log10(v) vs. log10(m) relationships held with selected values of ρ. Slopes were shallower for greater synchrony. (Middle) TL had a shallower slope for greater synchrony. Black lines show the average (across 50 simulations) TL slope plotted against average synchrony (error bars are standard deviations) and average (over 50 simulations) of the root mean squared errors (RSME) of log10(v) values from log10(v) vs. log10(m) linear regressions (labeled TL RMSE in the axis label). (B) Red lines are analytic approximations (Eq. 2 and Theorem 5 in SI Appendix, S2.3), computable with readily available software for continuous distributions (SI Appendix, S3), with + and × symbols indicating points for which approximations were deemed adequate via two different methods, respectively; both symbols are plotted when both methods indicate an adequate approximation. Each simulation consisted of 25 populations sampled 100 times each. (Bottom) Fractions of m and v values, which were 0 and therefore ignored, and fractions of 50 simulations, for which statistical tests rejected linearity or homoskedasticity of the log10(v) vs. log10(m) relationship with 95% confidence. Frac, fraction; Homosk, homoskedasticity; Lin, linearity. SI Appendix, Figs. S1–S32 show other parameters and distributions, which often showed similar patterns. Additional details are in SI Appendix, S3 and S6.
Fig. 2.
Fig. 2.
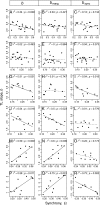
Plots of TL slope b against synchrony Ω for (A) 20 species of aphid in the United Kingdom, (D) 22 plankton groups in the seas around the United Kingdom, and (G, J, M, and P) chlorophyll-a density time series measured at 10 depths in groups 1–4 (Methods), which are distance categories from shore. A, D, G, J, M, and P are paired with contributions to the slope, b, of (B, E, H, K, N, and Q) marginal distribution structure (bmarg) and (C, F, I, L, O, and R) synchrony (bsync), respectively (Methods). Associations between synchrony and TL slope b can be due to associations between synchrony and bmarg, associations between synchrony and bsync, or both, because b = bmarg + bsync. SI Appendix, Fig. S99 shows another version of the figure that labels individual species/groups/depths.
Fig. 3.
Fig. 3.
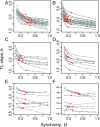
The dependence of the spatial TL slope b on synchrony Ω, where synchrony was manipulated through randomizations or sorting of time series (Methods) for (A) aphid species, (B) plankton groups, and (C–F) a chlorophyll-a density index measured at 10 depths. C is for 19 group-1 locations, F is for 12 group-4 locations, and D and E are for 12 locations in each of two intermediate distance categories (groups 2 and 3) (Methods). Red points on plotted lines correspond to individual unrandomized (A) aphid species, (B) plankton groups, and (C–F) sampling depths detailed in SI Appendix, Table S1. Gray points are averages over randomizations or sortings (Methods). Values for individual randomizations are shown in SI Appendix, Fig. S100.

Comment in

  • Unfinished synchrony.
    Plank MJ, Pitchford JW. Plank MJ, et al. Proc Natl Acad Sci U S A. 2017 Jun 27;114(26):6658-6660. doi: 10.1073/pnas.1707731114. Epub 2017 Jun 12. Proc Natl Acad Sci U S A. 2017. PMID: 28607083 Free PMC article. No abstract available.

References

    1. Taylor LR. Aggregation, variance and the mean. Nature. 1961;189:732–735.
    1. Döring TF, Knapp S, Cohen JE. Taylor’s power law and the stability of crop yields. Field Crops Res. 2015;183:294–302.
    1. Kuo TC, Mandal S, Yamauchi A, Hsieh CH. Life history traits and exploitation affect the spatial mean-variance relationship in fish abundance. Ecology. 2016;97:1251–1259. - PubMed
    1. Xu M, Kolding J, Cohen JE. Taylor’s power law and fixed precision sampling: Application to abundance of fish sampled by gillnets in an African lake. Can J Fish Aquat Sci. 2017;74:87–100.
    1. Taylor LR, Perry JN, Woiwod IP, Taylor RAJ. Specificity of the spatial power-law exponent in ecology and agriculture. Nature. 1988;332:721–722.

Publication types

LinkOut - more resources