

Deciphering the landscape of host barriers to Listeria monocytogenes infection
- PMID: 28559314
- PMCID: PMC5474794
- DOI: 10.1073/pnas.1702077114
Deciphering the landscape of host barriers to Listeria monocytogenes infection
Abstract
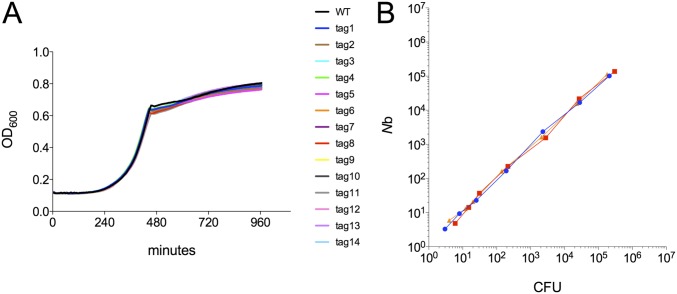
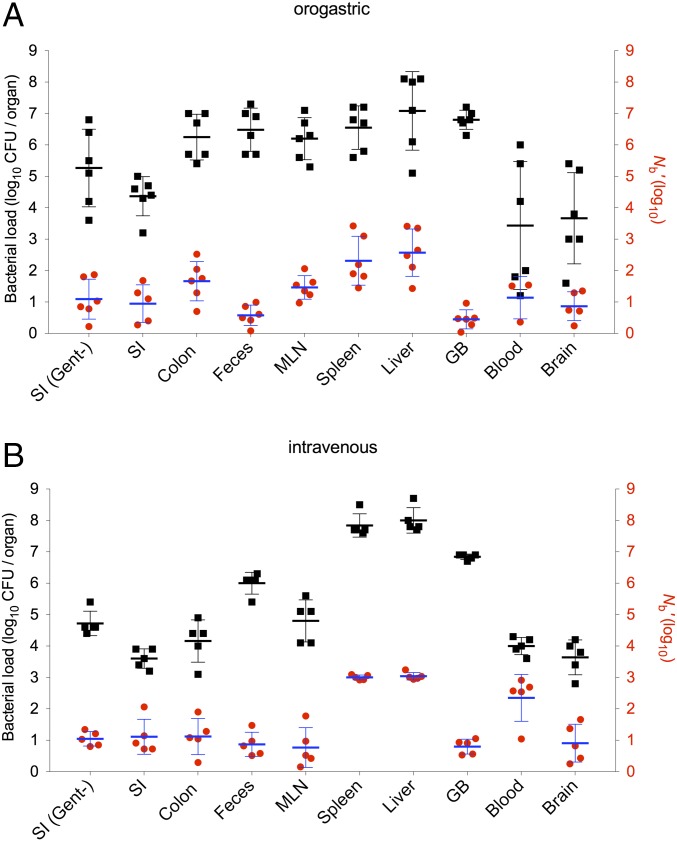
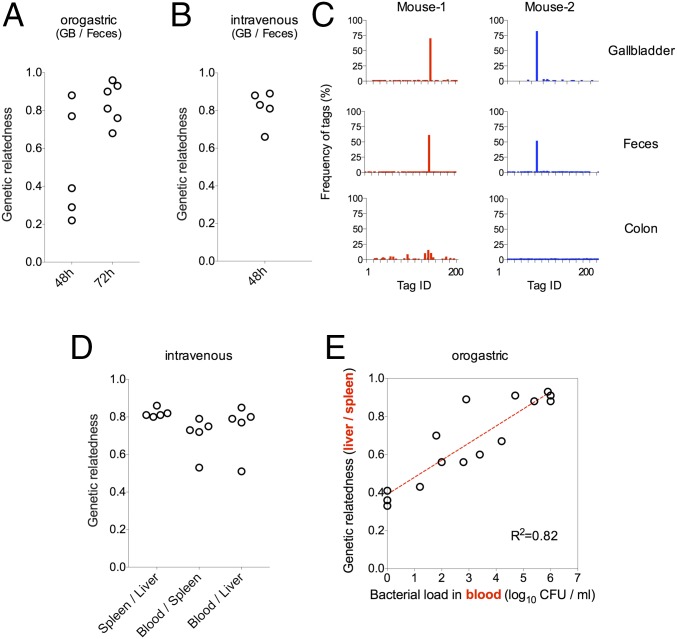
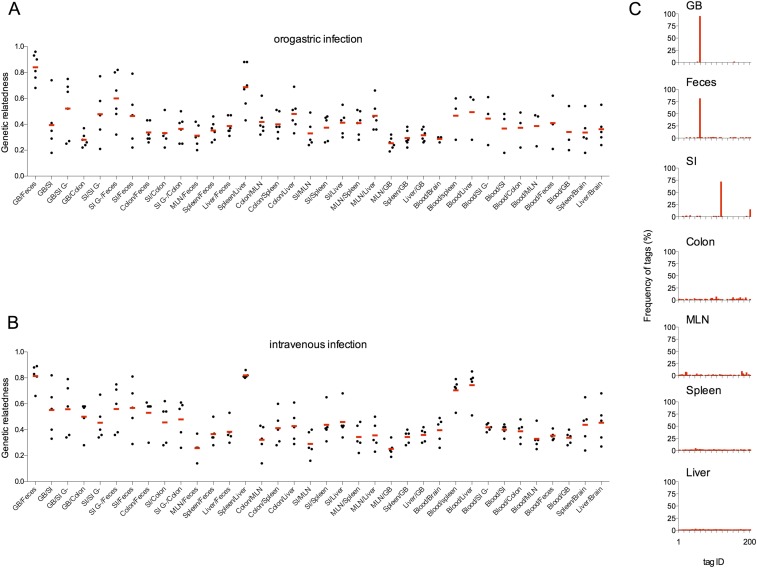
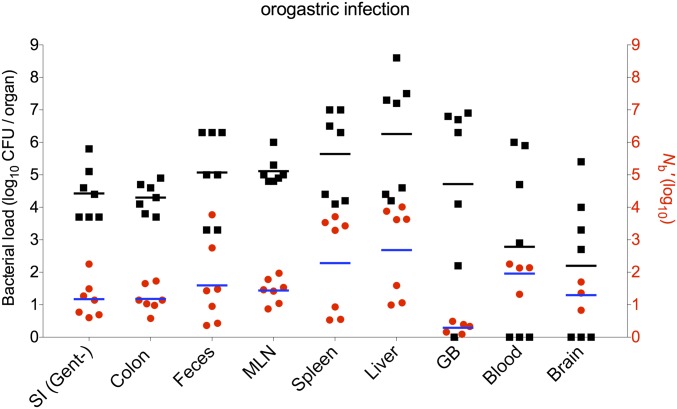
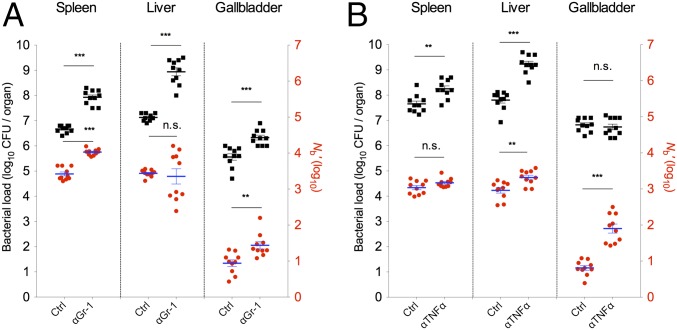
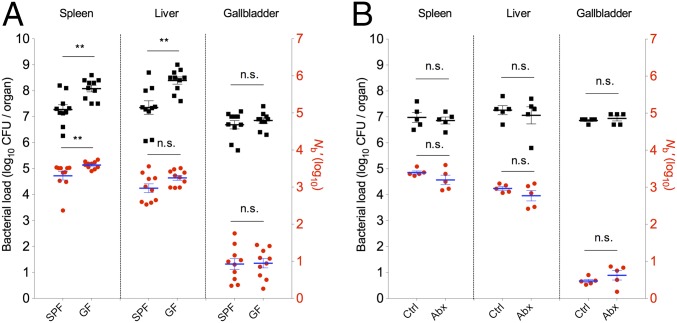
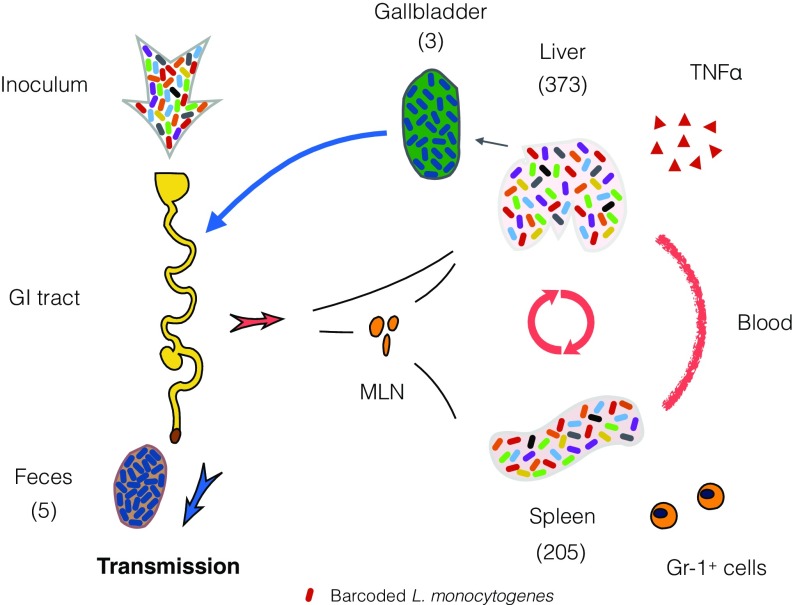
Listeria monocytogenes is a common food-borne pathogen that can disseminate from the intestine and infect multiple organs. Here, we used sequence tag-based analysis of microbial populations (STAMP) to investigate Lmonocytogenes population dynamics during infection. We created a genetically barcoded library of murinized Lmonocytogenes and then used deep sequencing to track the pathogen's dissemination routes and quantify its founding population (Nb) sizes in different organs. We found that the pathogen disseminates from the gastrointestinal tract to distal sites through multiple independent routes and that Nb sizes vary greatly among tissues, indicative of diverse host barriers to infection. Unexpectedly, comparative analyses of sequence tags revealed that fecally excreted organisms are largely derived from the very small number of L. monocytogenes cells that colonize the gallbladder. Immune depletion studies suggest that distinct innate immune cells restrict the pathogen's capacity to establish replicative niches in the spleen and liver. Finally, studies in germ-free mice suggest that the microbiota plays a critical role in the development of the splenic, but not the hepatic, barriers that prevent L. monocytogenes from seeding these organs. Collectively, these observations illustrate the potency of the STAMP approach to decipher the impact of host factors on population dynamics of pathogens during infection.
Keywords: Listeria monocytogenes; STAMP; pathogen dissemination; pathogen transmission; population dynamics.
Conflict of interest statement
The authors declare no conflict of interest.
Figures

Similar articles
-
Systemic infection of Mice with Listeria monocytogenes to characterize host immune responses.Methods Mol Biol. 2013;1031:125-44. doi: 10.1007/978-1-62703-481-4_16. Methods Mol Biol. 2013. PMID: 23824896
-
Increased Listeria monocytogenes Dissemination and Altered Population Dynamics in Muc2-Deficient Mice.Infect Immun. 2021 Mar 17;89(4):e00667-20. doi: 10.1128/IAI.00667-20. Print 2021 Mar 17. Infect Immun. 2021. PMID: 33431704 Free PMC article.
-
A Multiorgan Trafficking Circuit Provides Purifying Selection of Listeria monocytogenes Virulence Genes.mBio. 2019 Dec 17;10(6):e02948-19. doi: 10.1128/mBio.02948-19. mBio. 2019. PMID: 31848289 Free PMC article.
-
Tracing innate immune defences along the path of Listeria monocytogenes infection.Immunol Cell Biol. 2014 Aug;92(7):563-9. doi: 10.1038/icb.2014.27. Epub 2014 Apr 15. Immunol Cell Biol. 2014. PMID: 24732075 Review.
-
Early host-pathogen interactions in the liver and spleen during systemic murine listeriosis: an overview.Immunobiology. 1999 Dec;201(2):178-87. doi: 10.1016/S0171-2985(99)80057-6. Immunobiology. 1999. PMID: 10631566 Review.
Cited by
-
Infection of the murine placenta by Listeria monocytogenes induces sex-specific responses in the fetal brain.Pediatr Res. 2023 May;93(6):1566-1573. doi: 10.1038/s41390-022-02307-1. Epub 2022 Sep 20. Pediatr Res. 2023. PMID: 36127406
-
Chromosomal barcodes for simultaneous tracking of near-isogenic bacterial strains in plant microbiota.Nat Microbiol. 2024 Apr;9(4):1117-1129. doi: 10.1038/s41564-024-01619-8. Epub 2024 Mar 19. Nat Microbiol. 2024. PMID: 38503974 Free PMC article.
-
An experimental design tool to optimize inference precision in data-driven mathematical models of bacterial infections in vivo.J R Soc Interface. 2020 Dec;17(173):20200717. doi: 10.1098/rsif.2020.0717. Epub 2020 Dec 16. J R Soc Interface. 2020. PMID: 33323052 Free PMC article.
-
Quantification of Salmonella enterica serovar Typhimurium Population Dynamics in Murine Infection Using a Highly Diverse Barcoded Library.bioRxiv [Preprint]. 2024 Dec 11:2024.06.28.601246. doi: 10.1101/2024.06.28.601246. bioRxiv. 2024. Update in: Elife. 2025 Feb 13;13:RP101388. doi: 10.7554/eLife.101388. PMID: 38979326 Free PMC article. Updated. Preprint.
-
A genome-wide screen in ex vivo gallbladders identifies Listeria monocytogenes factors required for virulence in vivo.PLoS Pathog. 2025 Mar 3;21(3):e1012491. doi: 10.1371/journal.ppat.1012491. eCollection 2025 Mar. PLoS Pathog. 2025. PMID: 40029882 Free PMC article.
References
Publication types
MeSH terms
Grants and funding
LinkOut - more resources
Full Text Sources
Other Literature Sources
Medical
