. 2017 Jun 13;114(24):E4812-E4821.
doi: 10.1073/pnas.1704766114. Epub 2017 May 30.

Structure-guided evolution of antigenically distinct adeno-associated virus variants for immune evasion

Affiliations

Structure-guided evolution of antigenically distinct adeno-associated virus variants for immune evasion

Longping Victor Tse et al. Proc Natl Acad Sci U S A. .

Abstract

Preexisting neutralizing antibodies (NAbs) against adeno-associated viruses (AAVs) pose a major, unresolved challenge that restricts patient enrollment in gene therapy clinical trials using recombinant AAV vectors. Structural studies suggest that despite a high degree of sequence variability, antibody recognition sites or antigenic hotspots on AAVs and other related parvoviruses might be evolutionarily conserved. To test this hypothesis, we developed a structure-guided evolution approach that does not require selective pressure exerted by NAbs. This strategy yielded highly divergent antigenic footprints that do not exist in natural AAV isolates. Specifically, synthetic variants obtained by evolving murine antigenic epitopes on an AAV serotype 1 capsid template can evade NAbs without compromising titer, transduction efficiency, or tissue tropism. One lead AAV variant generated by combining multiple evolved antigenic sites effectively evades polyclonal anti-AAV1 neutralizing sera from immunized mice and rhesus macaques. Furthermore, this variant displays robust immune evasion in nonhuman primate and human serum samples at dilution factors as high as 1:5, currently mandated by several clinical trials. Our results provide evidence that antibody recognition of AAV capsids is conserved across species. This approach can be applied to any AAV strain to evade NAbs in prospective patients for human gene therapy.

Keywords: adeno-associated; antibody evasion; antigenicity; gene therapy; neutralizing antibody.


Conflict of interest statement

Conflict of interest statement: A.A. and M.A.-M. are cofounders of StrideBio, LLC, a company focused on commercializing AAV technologies for gene therapy and editing.

Figures

Fig. 1.
Fig. 1.
Structure-guided evolution of antigenically distinct AAV variants. (A) A 3D model of cryoreconstructed AAV1 capsid complexed with multiple mAbs. The model depicts AAV1 complexed with the Fab densities of four different mAbs viewed along the twofold axis: ADK1a (yellow), ADK1b (magenta), 4E4 (cyan), and 5H7 (orange). (B) Contact residues and CAMs for four anti-AAV1 antibodies on the capsid surface in a Roadmap image generated by RIVEM (29). Color codes of each antibody are same as above; in addition, overlapping residues between antibodies are colored individually: green, ADK1a and 4E4; gray, 4E4 and 5H7. (C) Individual antigenic footprints on the AAV1 capsid selected for engineering and AAV library generation. Three different AAV libraries were subjected to five rounds of evolution on vascular endothelial cells coinfected with adenovirus to yield single region AAV-CAM variants. (D) Iterative engineering and evolution of new antigenic footprints generated from single-region AAV-CAM variants. This approach yields antigenically distinct AAV-CAM variants with footprints that have not yet emerged in nature.
Fig. 2.
Fig. 2.
Library diversity, directed evolution, and enrichment of distinct antigenic footprints. (A–D) Parental and evolved libraries were subjected to high-throughput sequencing using the Illumina MiSeq platform. Following analysis with a custom Perl script, enriched amino acid sequences were plotted in R for both the parental and evolved libraries of region IV (A), region V (B), region VIII (C), and combined regions V + VIII (D). Each bubble represents a distinct capsid amino acid sequence with the area proportional to the number of reads for that variant in the respective library. (E–H) Amino acid sequence representation was calculated for the 10 variants with the highest representation in each library after subjection to evolution. Percentages represent the number of reads for the variant in the evolved library normalized to the total number of reads containing the antigenic region of interest. “Other” sequences represent all other evolved library amino acid sequences not contained in the top-10 hits.
Fig. S1.
Fig. S1.
Sequencing reads mapped to region of interest and representation of lead variants in unselected and selected libraries. (A) Percentage of sequencing reads mapped to the mutagenized region of interest for unselected and selected libraries CAM5, CAM8, CAM58, and CAM4. Demultiplexed FASTQ files were processed and mapped with a custom Perl script. (B) Percentage representation of amino acid sequences for lead variants in unselected and selected libraries, calculated by diving the reads containing a sequence of interest by the total reads containing the mutagenized region.
Fig. S2.
Fig. S2.
Physical and biological properties of CAM variants compared with AAV1. Representative electron micrographs of single region CAM variants CAM106 (A), CAM108 (B), CAM109 (C), and combined CAM variants CAM117 (E), CAM125 (F), CAM130 (G), and AAV1 (D). (Scale bar: 100 nm.) (H) Western blot analysis of capsid proteins of CAM variants using the B1 anti-AAV capsid mAb. (I) Titers of purified CAM variants produced using the triple plasmid transfection protocol in HEK293 cells (four 150-mm culture dishes). (J and K) Transduction profiles of single CAM variants (J) and combined CAM variants (K) compared with AAV1 on vascular endothelial cells (MB114).
Fig. 3.
Fig. 3.
Neutralization profile of AAV1 and single region CAM variants against mouse mAbs in vitro and in vivo. (A–C) Different AAV strains, AAV1 (black bars), CAM106 (red bars), CAM108 (blue bars), and CAM109 (green bars) evaluated against mAbs 4E4, 5H7, and ADK1a in HEK293 cells in vitro (1,000 vg/cell) at different dilutions of hybridoma media. Relative luciferase transgene expression mediated by different vectors mixed with mAbs was normalized to no-antibody controls. Error bars represent SD (n = 4). (D) Roadmap images of the threefold axis of each CAM mutant showing the location of newly evolved antigenic footprints: CAM106 (red), CAM108 (blue), and CAM109 (green). (E–H) Luciferase expression in mouse hindlimb muscles injected with a dose of 2 × 10¹⁰ vg of AAV1, CAM106, CAM108, and CAM109 vectors packaging ssCBA-Luc and mixed with different mAbs. Representative live animal images at 4 wk postinjection are shown in the following subgroups: no- antibody control (E), 4E4 (1:500) (F), 5H7 (1:50) (G), and ADK1a (1:5) (H). (I) Quantitation of luciferase activity mediated by different CAM variants relative to parental AAV1. Luciferase activity is expressed as photons/s/cm2/sr as calculated with Living Image 3.2 software. Error bars represent SD (n = 3).
Fig. 4.
Fig. 4.
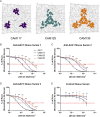
Neutralization profiles of AAV1 and CAM variants in preimmunized mouse antisera. (A) Roadmap images of each antigenically distinct CAM variant showing newly evolved footprints at the threefold symmetry axis: CAM117 (regions IV + V, purple), CAM125 (regions V + VIII, cyan) and CAM130 (regions IV + V + VIII, orange). (B–E) Anti-AAV1 mouse serum from three individual animals (B–D) and control mouse serum (E) were serially diluted in twofold increments from 1:50 to 1:3,200 and then coincubated with AAV vectors in vitro (5,000 vg/cell). The dotted red line represents NAb-mediated inhibition of AAV transduction by 50%. Solid lines represent relative transduction efficiencies of AAV1 (black), CAM117 (purple), CAM125 (cyan), and CAM130 (orange) at different dilutions of antisera. Error bars represent SD (n = 3).
Fig. 5.
Fig. 5.
Neutralization profiles of AAV1 and CAM130 in NHP antisera. Serum samples collected from three individual rhesus macaques collected preimmunization (naïve) and postimmunization (at 4 wk and 9 wk) were serially diluted in twofold increments from 1:5 to 1:320 and coincubated with AAV vectors in vitro (10,000 vg/cell). (A) Primate serum 1 (naïve). (B) Anti-AAV primate serum 1 (4 wk). (C) Anti-AAV primate serum 1 (9 wk). (D) Primate serum 2 (naïve). (E) Anti-AAV primate serum 2 (4 wk). (F) Anti-AAV primate serum 2 (9 wk). (G) Primate serum 3 (naïve). (H) Anti-AAV primate serum 3 (4 wk). (I) Anti-AAV primate serum 3 (9 wk). The dotted red line represents NAb-mediated inhibition of AAV transduction by 50%. Solid lines represent relative transduction efficiencies of AAV1 (black) and CAM130 (orange) at different dilutions of antisera. Error bars represent SD (n = 3).
Fig. 6.
Fig. 6.
Neutralization profile of AAV1 and CAM130 against individual NHP and human serum samples. AAV1 and CAM130 packaging ssCBA-Luc (10,000 vg/cell) were tested against NHP (A) and human (B) sera at 1:5 dilution to reflect clinically relevant exclusion criteria. The dotted red line represents NAb-mediated inhibition of AAV transduction by 50%. Bars represent relative transduction efficiencies of AAV1 (black) and CAM130 (orange). Error bars represent SD (n = 3).
Fig. S3.
Fig. S3.
In vivo characterization of the CAM130 variant. (A–D) Representative images (n = 4 animals) of immunohistochemically stained GFP+ sections of mouse cardiac (A and B) and brain (C and D) tissue transduced by AAV1 or CAM130 vectors packaging scCBh-GFP vector genomes at 4 wk postadministration. (E and F) Immunohistochemical staining of GFP expression in specific brain regions including motor cortex, cortex, and hippocampus after intra-CSF administration of AAV1 (E) and CAM130 (F) shown at higher magnification. (Scale bars: 200 µm unless labeled otherwise.) (G and H) Quantitation of GFP+ cardiac myofibers (G) and luciferase transgene expression in the heart (H) for AAV1 (black dots) and CAM130 (orange dots) at 2 wk after i.v. administration of 1 × 10¹¹ vg/mouse (n = 5). (I) Quantitation of GFP+ neurons in coronal brain sections following intra-CSF administration of AAV1 (black dots) and CAM130 (orange) (n = 4).
Fig. S4.
Fig. S4.
Transduction profile of the CAM130 variant compared with AAV1 in multiple organs. (A) Luciferase transgene expression in the liver, muscle, lung, brain, kidney, and spleen for AAV1 (black dots) and CAM130 (orange dots) at 2 wk after i.v. administration of 1 × 10¹¹ vg/mouse (n = 5). The dotted red line represents background level activity from mock-injected mice. (B) Biodistribution of AAV1 and CAM130 vector genomes in heart and liver. Vector genome copy numbers per cell were calculated, and values from mock-injected controls were subtracted to obtain final values. Each dot represents a duplicated experiment from a single animal (n = 5), and the dash represents the mean value.

References

    1. Ledford H. Success against blindness encourages gene therapy researchers. Nature. 2015;526:487–488. - PubMed
    1. Nienhuis AW, Nathwani AC, Davidoff AM. Gene therapy for hemophilia. Hum Gene Ther. 2016;27:305–308. - PubMed
    1. Hastie E, Samulski RJ. Adeno-associated virus at 50: A golden anniversary of discovery, research, and gene therapy success—a personal perspective. Hum Gene Ther. 2015;26:257–265. - PMC - PubMed
    1. Greenberg B, et al. Prevalence of AAV1 neutralizing antibodies and consequences for a clinical trial of gene transfer for advanced heart failure. Gene Ther. 2016;23:313–319. - PMC - PubMed
    1. Tse LV, Moller-Tank S, Asokan A. Strategies to circumvent humoral immunity to adeno-associated viral vectors. Expert Opin Biol Ther. 2015;15:845–855. - PMC - PubMed

Publication types

MeSH terms