. 2017 Jun 13;114(24):E4762-E4771.
doi: 10.1073/pnas.1619434114. Epub 2017 May 30.

Estimating the parameters of background selection and selective sweeps in Drosophila in the presence of gene conversion

Affiliations

Estimating the parameters of background selection and selective sweeps in Drosophila in the presence of gene conversion

José Luis Campos et al. Proc Natl Acad Sci U S A. .

Abstract

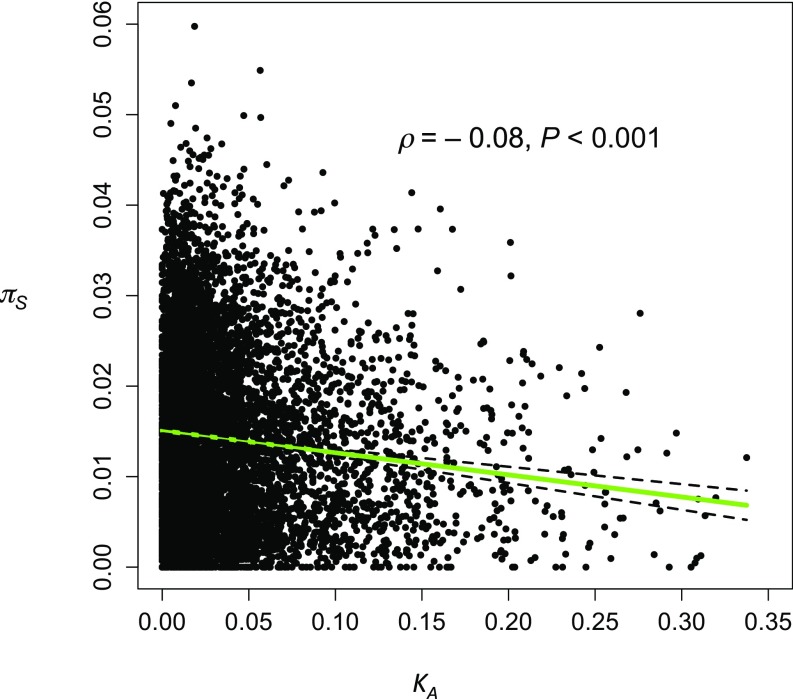
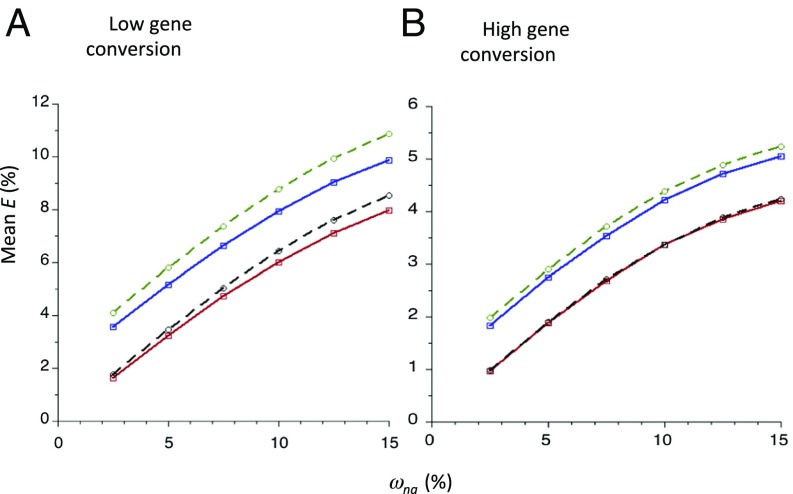
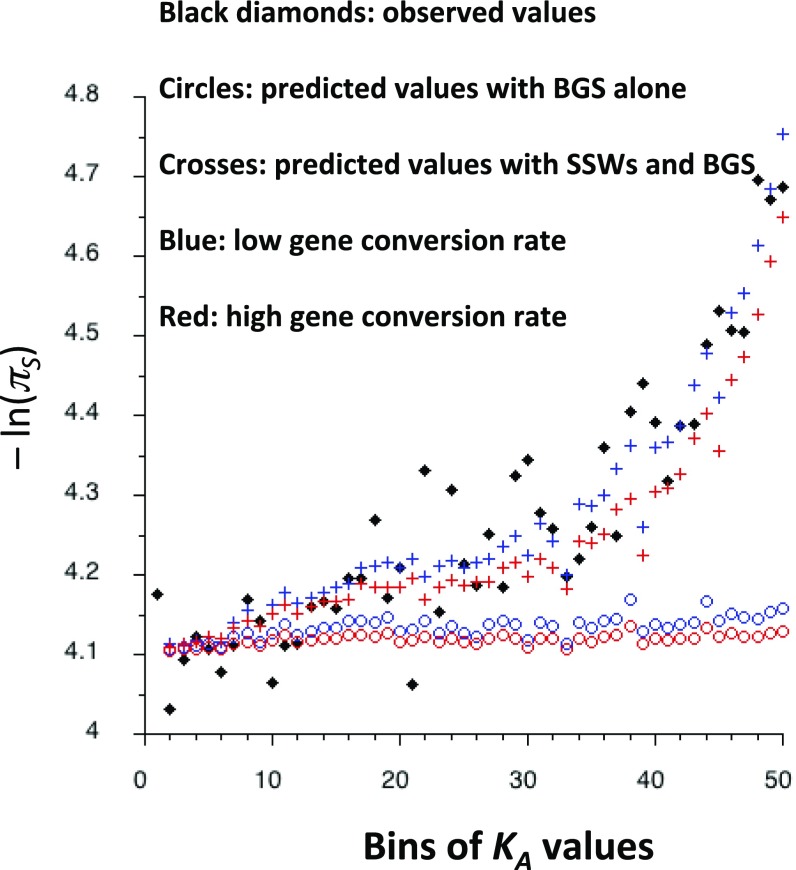
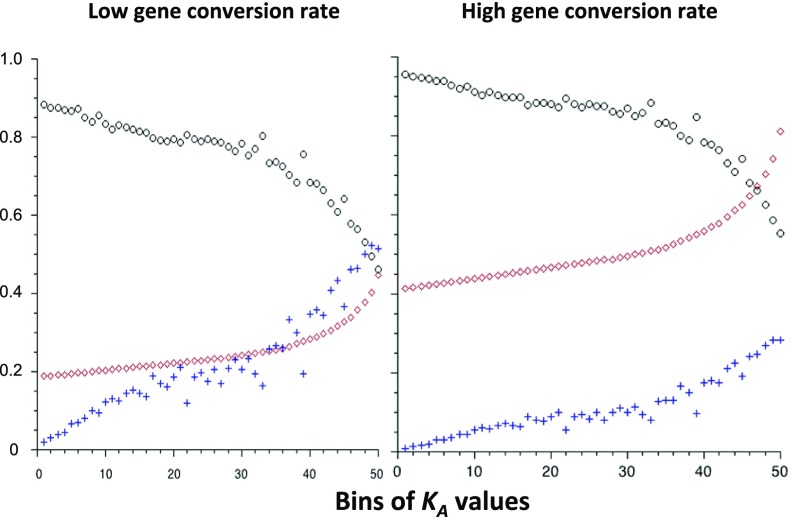
We used whole-genome resequencing data from a population of Drosophila melanogaster to investigate the causes of the negative correlation between the within-population synonymous nucleotide site diversity (πS ) of a gene and its degree of divergence from related species at nonsynonymous nucleotide sites (KA ). By using the estimated distributions of mutational effects on fitness at nonsynonymous and UTR sites, we predicted the effects of background selection at sites within a gene on πS and found that these could account for only part of the observed correlation between πS and KA We developed a model of the effects of selective sweeps that included gene conversion as well as crossing over. We used this model to estimate the average strength of selection on positively selected mutations in coding sequences and in UTRs, as well as the proportions of new mutations that are selectively advantageous. Genes with high levels of selective constraint on nonsynonymous sites were found to have lower strengths of positive selection and lower proportions of advantageous mutations than genes with low levels of constraint. Overall, background selection and selective sweeps within a typical gene reduce its synonymous diversity to ∼75% of its value in the absence of selection, with larger reductions for genes with high KA Gene conversion has a major effect on the estimates of the parameters of positive selection, such that the estimated strength of selection on favorable mutations is greatly reduced if it is ignored.

Keywords: Drosophila melanogaster; background selection; gene conversion; selective sweeps; sequence diversity.


Conflict of interest statement

The authors declare no conflict of interest.

Figures

Fig. 1.
Fig. 1.
The plot of synonymous diversity (πS) for genes in a Rwandan population of D. melanogaster against their nonsynonymous divergence from D. yakuba (KA); ρ is the Spearman rank correlation coefficient. The green line is the least-squares linear regression (the dashed lines are its 95% CIs).
Fig. 2.
Fig. 2.
This plots the theoretical values of mean E (percent) against values of mean ωna (percent) for the standard model of a single gene with five exons of 100 codons each; a gamma distribution of selection coefficients with β = 0.3 was assumed, with γc = 5. For the results obtained by the summation method (red and blue solid lines), the exons were separated by four introns of 100 bp. For the results obtained from the integral model (black and green dashed lines), a continuous stretch of coding sequence was assumed. The green and blue lines show the net BGS effects arising from both NS and UTR sites; the black and red lines show the effects for NS sites alone. Two-thirds of coding sites were assumed to result in NS mutations. The rate of crossing over per base pair was 1 × 10⁻⁸, and the mutation rate was 4.5 × 10⁻⁹ per base pair. The gene conversion parameters for the low gene conversion case (A) were gc = 1 × 10⁻⁸ and dg = 440; for the high gene conversion case (B), gc = 5 × 10⁻⁸ and dg = 500. No large effect mutations were allowed.
Fig. 3.
Fig. 3.
The black diamonds are the observed values of −ln(πS) for each bin of KA values for autosomes, corrected for the correlation between πS and KS as described in Materials and Methods, Primary Data Analyses. The circles are the theoretical values of mean E for each bin, obtained by the integral model of BGS, assuming a single gene with 500 NS sites. The crosses are the predicted values of −ln(πS) for each bin, given by the combined BGS and SSW models at NS and UTR sites. Red and blue correspond to the low and high gene conversion rates used in Fig. 2. The mutation rate and crossing-over parameters are as in Fig. 2, except that large effect mutations constitute 15% of all mutations, with a selection coefficient against heterozygotes of 0.044.
Fig. 4.
Fig. 4.
The black circles are the predicted values of πS relative to its expected value in the absence of hitchhiking; the red diamonds are the estimates of γa (multiplied by 10−3); the blue crosses are the estimates of pa (multiplied by 103). The other parameters are as in Fig. 3, assuming effects of BGS and SSWs at both NS and UTR sites.

References

    1. Cutter AD, Payseur BA. Genomic signatures of selection at linked sites: Unifying the disparity among species. Nat Rev Genet. 2013;14:262–274. - PMC - PubMed
    1. Charlesworth B, Campos JL. The relations between recombination rate and patterns of molecular variation and evolution in Drosophila. Annu Rev Genet. 2014;48:383–403. - PubMed
    1. Corbett-Detig RB, Hartl DL, Sackton TB. Natural selection constrains neutral diversity across a wide range of species. PLoS Biol. 2015;13:e1002112. - PMC - PubMed
    1. Smith JM, Haigh J. The hitch-hiking effect of a favourable gene. Genet Res. 1974;23:23–35. - PubMed
    1. Charlesworth B, Morgan MT, Charlesworth D. The effect of deleterious mutations on neutral molecular variation. Genetics. 1993;134:1289–1303. - PMC - PubMed

Publication types

LinkOut - more resources