. 2017 Jun 13;114(24):E4859-E4867.
doi: 10.1073/pnas.1701078114. Epub 2017 May 30.

Contacts between the endoplasmic reticulum and other membranes in neurons

Affiliations

Contacts between the endoplasmic reticulum and other membranes in neurons

Yumei Wu et al. Proc Natl Acad Sci U S A. .

Abstract

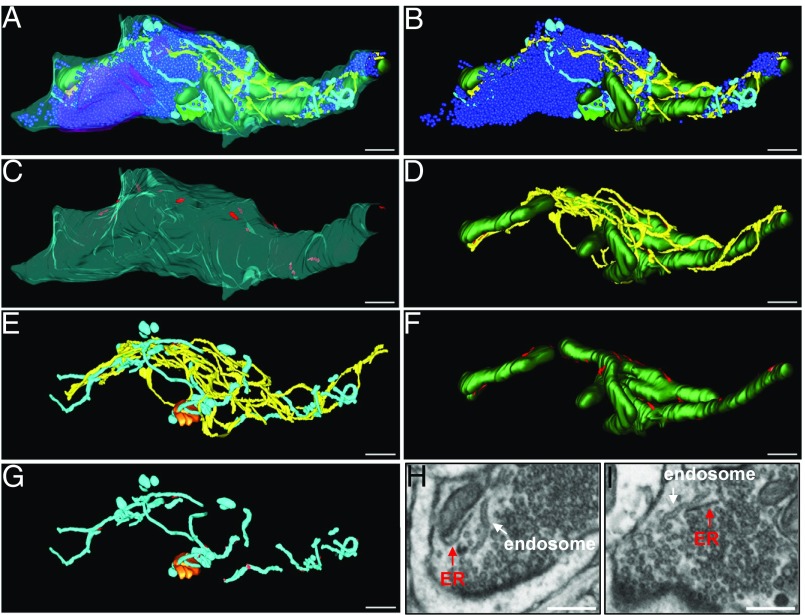
Close appositions between the membrane of the endoplasmic reticulum (ER) and other intracellular membranes have important functions in cell physiology. These include lipid homeostasis, regulation of Ca2+ dynamics, and control of organelle biogenesis and dynamics. Although these membrane contacts have previously been observed in neurons, their distribution and abundance have not been systematically analyzed. Here, we have used focused ion beam-scanning electron microscopy to generate 3D reconstructions of intracellular organelles and their membrane appositions involving the ER (distance ≤30 nm) in different neuronal compartments. ER-plasma membrane (PM) contacts were particularly abundant in cell bodies, with large, flat ER cisternae apposed to the PM, sometimes with a notably narrow lumen (thin ER). Smaller ER-PM contacts occurred throughout dendrites, axons, and in axon terminals. ER contacts with mitochondria were abundant in all compartments, with the ER often forming a network that embraced mitochondria. Small focal contacts were also observed with tubulovesicular structures, likely to be endosomes, and with sparse multivesicular bodies and lysosomes found in our reconstructions. Our study provides an anatomical reference for interpreting information about interorganelle communication in neurons emerging from functional and biochemical studies.

Keywords: FIB-SEM; Stim1; spine apparatus; subsurface cisternae; thin ER.


Conflict of interest statement

The authors declare no conflict of interest.

Figures

Fig. 1.
Fig. 1.
Organization of the ER in a neuronal cell body. Three-dimensional reconstruction of subcellular organelles from a FIB-SEM image stack of a neuronal cell body (nucleus accumbens). (A) A portion of the peripheral cytoplasm, including all membranous organelles in the region, is shown in a view from the inside of the cell. (B) Plasma membrane areas in contact with the ER are shown in red: bright red for wide ER cisternae and dark red for “thin” ER (i.e., ER cisternae where the two opposite faces of the cisternae are tightly apposed to each other so that lumen of the ER can no longer be appreciated at the resolving power of FIB-SEM). Note the spatial separation of these contact areas from postsynaptic areas (white; one asterisk represents symmetric synapses; two asterisks represent asymmetric synapse). (C and D) ER and mitochondria sites of contact are shown in red in D. (E and F) ER and tubules or vesicles not connected to the ER (endosomes and transport vesicles) with contact sites areas shown in red in F. (G and H) ER and lysosomes/multivesicular bodies; contact sites are shown in red in H. (Scale bars: 400 nm; 80 nm in Inset in J.)
Fig. S1.
Fig. S1.
Organization of the ER and other organelles in a dendrite and surrounding axon terminals. Cerebral cortex. Three-dimensional model from a FIB-SEM image stack. Color codes are as in Fig. 1. In addition, synaptic vesicles are shown in dark blue and the outer surfaces of the PMs of the dendrite and of the axons are shown in light blue and green, respectively, in A. (A) Outside view. (B) Same as A but with transparent PMs and all organelles shown. (C) PM in contact with the ER shown in red. (D) Mitochondria with areas of contact with the ER shown in red. A long white arrow points to the only mitochondrion present in the dendritic segment, and small white arrows point to shorter mitochondria in axon terminals. (E) Endosomes and vesicles other than synaptic vesicles with contact sites with the ER shown in red. The profiles of the PMs of the dendrite and of axon terminals are shown in dashed light blue and green lines, respectively. (F) Large dendritic spines containing both ER and mitochondria. (G) Thin spine devoid of both ER and mitochondria (ER pictured is presynaptic). In both F and G, synaptic vesicles and the ER of adjacent nerve terminals are also shown. (Scale bars: 800 nm in A–E; 400 nm in F and G.)
Fig. 2.
Fig. 2.
Analysis of contact sites of the ER with the PM and other membranous organelles in different neuronal compartments. (A and B) Morphometric analysis. (A) Percentages of the area of the PM and of the surface of intracellular organelles in close apposition with the ER from the three reconstructions shown in Figs. 1, 3, and 5. Note the greater area of ER–PM contacts in cell bodies. (B) Percentage of PM perimeter of neuronal cell bodies in close apposition with wide and thin ER, respectively, as assessed by TEM micrographs (n = 20 neurons for each region). (C–H) Gallery of micrographs obtained by FIB-SEM at 8 × 8 × 8- (C) and 4 × 4 × 4-nm (D–H) voxel size sampling in the x, y, and z dimensions. (C) ER making contact with a lysosome (red asterisk) in a neuronal cell body. (D–F) Portions of dendrites showing ER making contacts (red arrows) with a multivesicular body (D), a mitochondrion (E), and the PM (F), respectively. Two Insets in F show the ER making contacts (red arrows) with the PM in two small axons. (G and H) ER making contacts (red arrows) with a mitochondrion (E) and with the PM (F) in two axon terminals. All images are from the nucleus accumbens. (Scale bars: 200 nm; 80 nm for Insets in D and F.)
Fig. 3.
Fig. 3.
Thin ER at ER–PM contact sites in neuronal somata. (A and B) ER–PM contacts in FIB-SEM images. Although in A the ER maintains its thickness when making contact with the PM (wide ER), in some ER (B), the lumen virtually disappears (thin ER) upon contact with the PM. Note in B that ribosomes are associated with the dilated portion of the ER (away from the PM), but are absent from the thin ER. (C) TEM micrographs showing the tight apposition of the two opposite faces of thin cortical ER cisternae (red arrows), with near absence of an ER lumen. (D and E) TEM micrographs showing thin cortical ER (thin red arrows) apposed by wide ER with electron-dense accumulations between them (thick short red arrows). (F) Symmetric arrangement of thin cortical ER in two adjacent neurons. The portions enclosed by white rectangles are shown at higher magnification in the two Insets. (G–I) Symmetric cortical ER between two adjacent neurons as seen by FIB-SEM (G) and corresponding 3D reconstruction (H and I) shown in two different orientations. [Scale bars: 200 nm in A–E; 500 nm in F (Inset, 200 nm); 160 nm in G and H.] A and B are from the nucleus accumbens, B–E from the dorsal striatum, and F from the cerebral cortex.
Fig. S2.
Fig. S2.
Thin ER at ER–PM contact sites. Dorsal striatum. (A and B) TEM micrographs showing thin cortical ER (thin red arrows) flanked by wide ER, with electron dense accumulations between them (thick red arrows). The electron-dense appearance of the thin ER is because of the virtual absence of the lumen, so that the two opposite membranes of the ER cisterns are closely apposed to the each and appear as a single thick membrane at the resolution of FIB-SEM. (C) Thin cortical ER at sites where two adjacent neurons contact each other. The thin ER cisternae (thin red arrows) in the two neurons are in close register with each other. The portion enclosed by white rectangles is shown at higher magnification in the bottom right Inset. Rough ER (RER) in continuity with the smooth thin ER (thin red arrow) is indicated. (Scale bars: 200 nm in A and B and Inset in C; 500 nm in C.)
Fig. 4.
Fig. 4.
Organization of the ER in dendrites. Three-dimensional model of subcellular organelles from a FIB-SEM image stack of a dendritic segment (nucleus accumbens). (A) The model includes all membranous organelles present in this dendrite color-coded as in Fig. 1. Note the continuity of the ER and its penetration into a subset of dendritic spines. (B) The ER, mitochondria, and endosomes and transport vesicles. (C and D) PM and mitochondria, respectively; areas of contacts with the ER shown in red. (E) Endosomes + transport vesicles areas of contact with the ER are shown in red in the Insets. Other contacts with the ER not visible in this view can be seen in Movie S2. (Scale bars: 800 nm.) (F and G) Pie charts showing the percent of spines containing ER in neurons of the nucleus accumbens and of the dorsal striatum, respectively, as assessed by inspection of two FIB-SEM datasets.
Fig. 5.
Fig. 5.
ER and other organelles in dendritic spines. (A–D) Three-dimensional models of two adjacent spines emerging from a dendrite (from FIB-SEM image stacks, nucleus accumbens). (A) All membranous organelles were reconstructed (color coded as in Fig. 1). (B and C) PM and mitochondria, respectively; areas of contacts with the ER shown in red. A cluster of endosomes/transport vesicles with two areas of contact with the ER (red) visible in the Inset of C. (D) ER of one of the two spines shown in A. (E–H) Mushroom-shaped dendritic spine in the cerebral cortex containing a typical spine apparatus. (E) Three-dimensional model of the spine showing all organelles (color coded as in Fig. 1). (F) Single FIB-SEM image showing a cross-section of the spine apparatus, which comprises seven cisternae, one of which makes a contact with the PM in the plane of the image (red arrow). (G and H) Three-dimensional reconstruction of the spine apparatus shown in F, demonstrating two contacts with the PM (red) (H). (Scale bars: 400 nm in A–E; 80 nm in Inset in C; 80 nm in F–H.)
Fig. 6.
Fig. 6.
ER network in an axon. (A–D) Three-dimensional model of a thin axonal segment (from a FIB-SEM image stack, nucleus accumbens). (A) All membranous organelles were reconstructed; they are color-coded as in Fig. 1. In addition, synaptic vesicles are shown in dark blue. A single ER tubule travels along the axon and expands into small tubular networks at presynaptic varicosities. (B) Selective view of the ER, mitochondria, and endosomes and free vesicles excluding synaptic vesicles. (C) PM where areas of contacts with the ER are shown in red. (D) Endosomes and free vesicles excluding synaptic vesicles (synaptic vesicles were defined as the small, homogenously sized small vesicles clustered together at presynaptic sites). Contact sites between the ER and tubulovesicular structures (most likely endosomes) are shown in red in the two insets. (E–H) High-magnification views of selected organelles in the largest presynaptic varicosity of the axonal segment shown in A. The synaptic interface is shown in magenta. Contacts areas between the ER and mitochondria are highlighted in red in field H. (I and J) Three-dimensional model in a myelinated axon showing the PM, the ER, and a membrane tubule not continuous with the ER (endosome or other transport intermediate; nucleus accumbens). Contact between the ER and the PM and with an isolated tubule (endosome or other transport intermediate) are shown in red in I and J, respectively. (K and L) Micrographs showing original FIB-SEM dataset from which the 3D reconstruction of field E was obtained. Active zones of secretion (AZ) are indicated by white stippled rectangles. (M and N) Micrographs from original FIB-SEM data set illustrating cross-sections of the axons shown in A and I, respectively. (Scale bars: 800 nm in A–D; 40 nm in Insets in D; 160 nm in E–H; 400 nm in I–L; 160 nm in M and N.)
Fig. 7.
Fig. 7.
ER and other organelles in a large presynaptic varicosity. (A–G) Three-dimensional model of the nerve terminal (from FIB-SEM image stacks, nucleus accumbens). (A) All membranous organelles and the synaptic interface were reconstructed and color coded as in Fig. 1; synaptic vesicles are in dark blue and the synaptic interface in magenta. (B–G) View of selected organelles with red color indicating contacts with the ER. (H and I) Two images from the FIB-SEM stack used for the 3D reconstruction illustrating the different morphology of two types of tubular elements: the thinner/darker tubules are defined as ER because of their continuity with the ER network of the axon. The larger tubules (shown in light blue in the 3D reconstruction) are disconnected from the ER; they are reminiscent of the tubular endosomal structures observed in some nerve terminals (60, 99). (Scale bars: 400 nm.)

Similar articles

Cited by

References

    1. Porter KR. Observations on a submicroscopic basophilic component of cytoplasm. J Exp Med. 1953;97:727–750. - PMC - PubMed
    1. Shibata Y, Hu J, Kozlov MM, Rapoport TA. Mechanisms shaping the membranes of cellular organelles. Annu Rev Cell Dev Biol. 2009;25:329–354. - PubMed
    1. Friedman JR, Voeltz GK. The ER in 3D: A multifunctional dynamic membrane network. Trends Cell Biol. 2011;21:709–717. - PMC - PubMed
    1. McNew JA, Sondermann H, Lee T, Stern M, Brandizzi F. GTP-dependent membrane fusion. Annu Rev Cell Dev Biol. 2013;29:529–550. - PubMed
    1. Wang S, Romano FB, Field CM, Mitchison TJ, Rapoport TA. Multiple mechanisms determine ER network morphology during the cell cycle in Xenopus egg extracts. J Cell Biol. 2013;203:801–814. - PMC - PubMed

Publication types