. 2017 Jun 13;114(24):E4851-E4858.
doi: 10.1073/pnas.1702290114. Epub 2017 May 30.

Input timing for spatial processing is precisely tuned via constant synaptic delays and myelination patterns in the auditory brainstem

Affiliations

Input timing for spatial processing is precisely tuned via constant synaptic delays and myelination patterns in the auditory brainstem

Annette Stange-Marten et al. Proc Natl Acad Sci U S A. .

Abstract

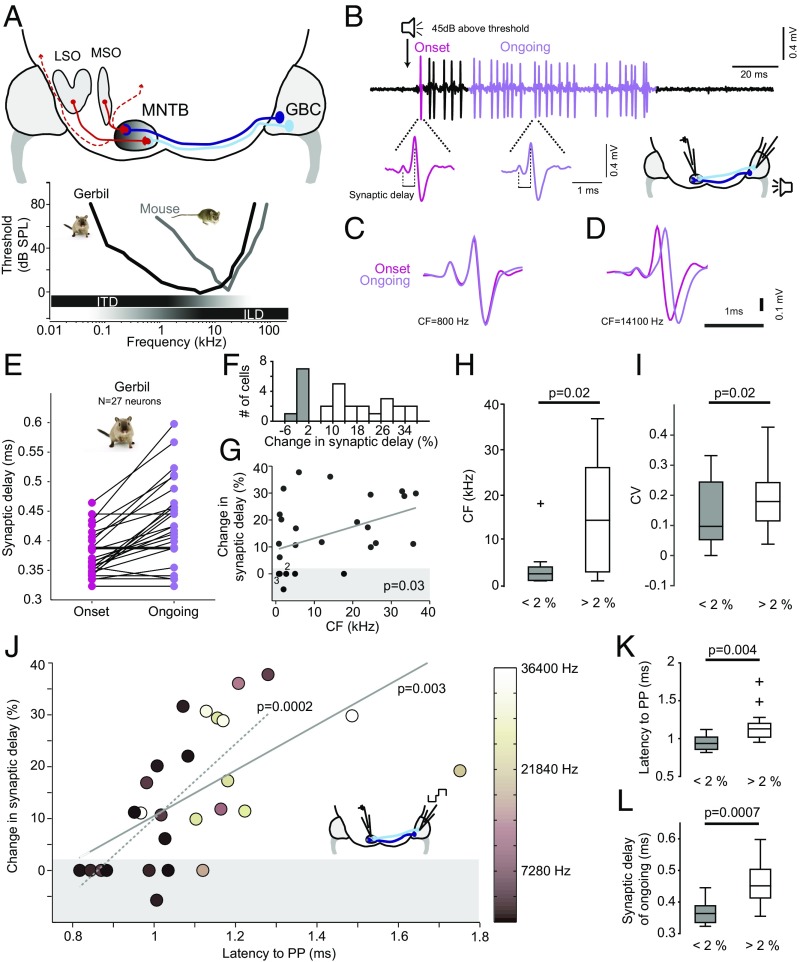
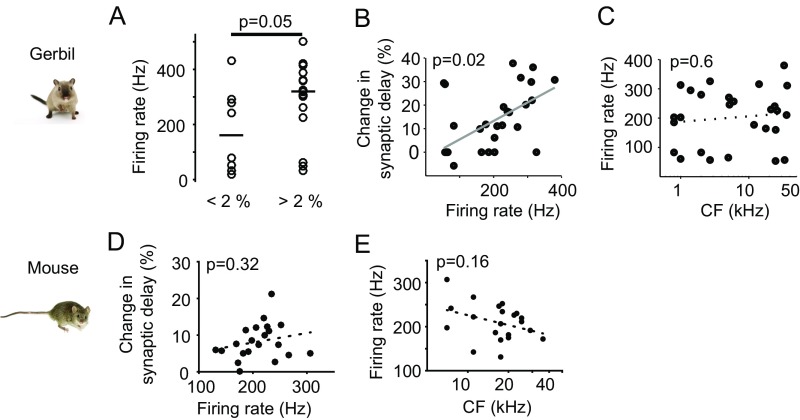
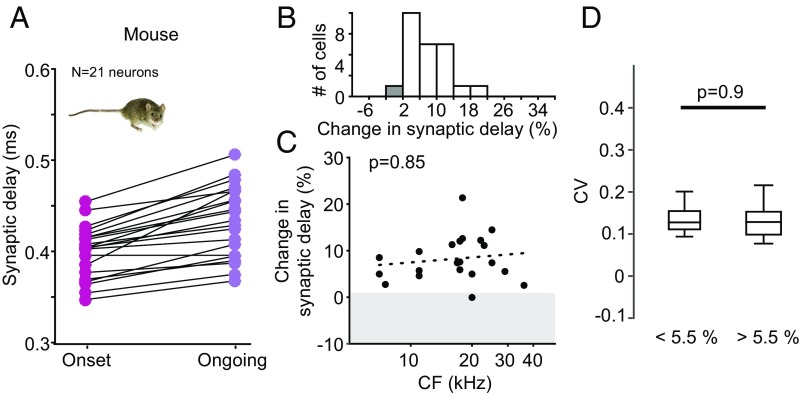
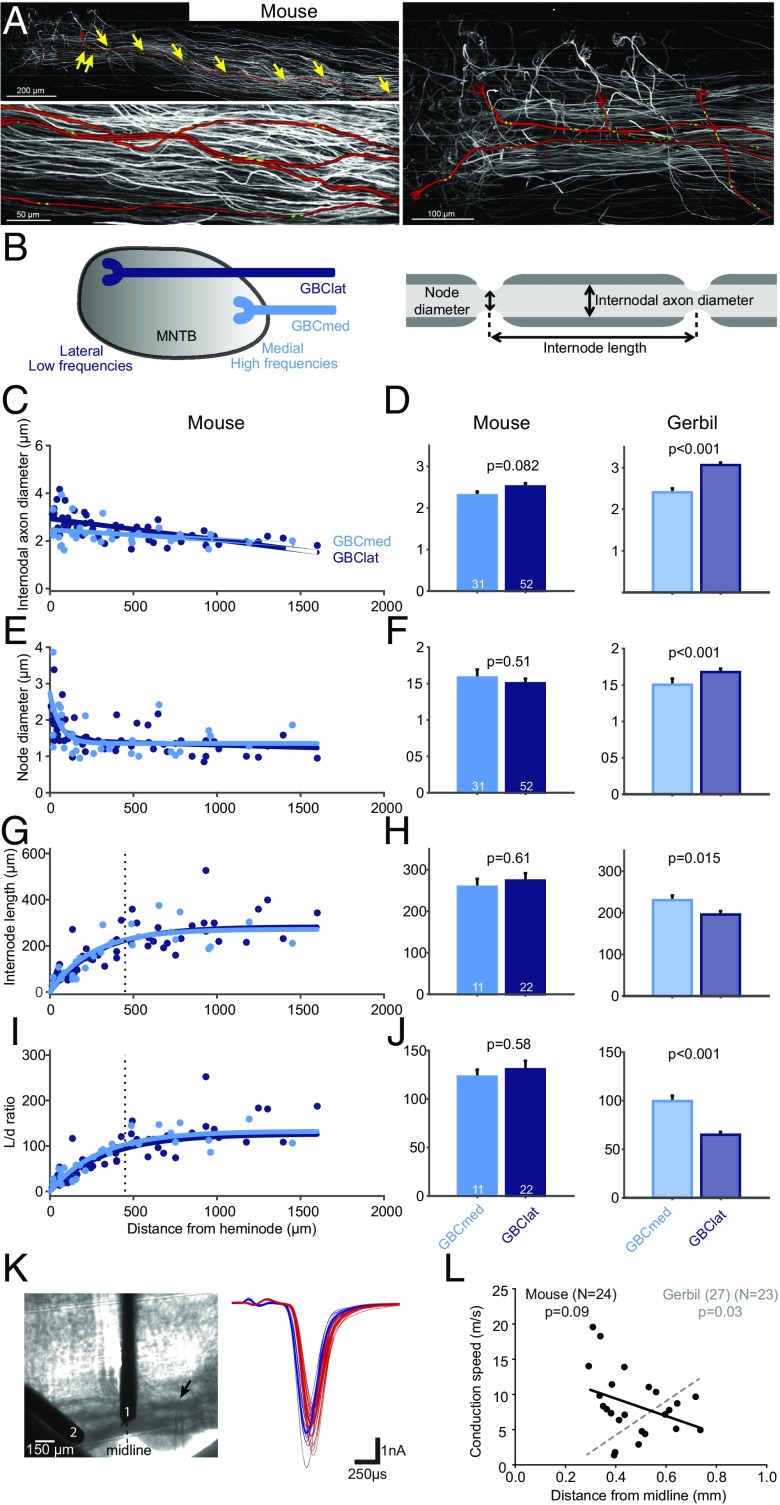
Precise timing of synaptic inputs is a fundamental principle of neural circuit processing. The temporal precision of postsynaptic input integration is known to vary with the computational requirements of a circuit, yet how the timing of action potentials is tuned presynaptically to match these processing demands is not well understood. In particular, action potential timing is shaped by the axonal conduction velocity and the duration of synaptic transmission delays within a pathway. However, it is not known to what extent these factors are adapted to the functional constraints of the respective circuit. Here, we report the finding of activity-invariant synaptic transmission delays as a functional adaptation for input timing adjustment in a brainstem sound localization circuit. We compared axonal and synaptic properties of the same pathway between two species with dissimilar timing requirements (gerbil and mouse): In gerbils (like humans), neuronal processing of sound source location requires exceptionally high input precision in the range of microseconds, but not in mice. Activity-invariant synaptic transmission and conduction delays were present exclusively in fast conducting axons of gerbils that also exhibited unusual structural adaptations in axon myelination for increased conduction velocity. In contrast, synaptic transmission delays in mice varied depending on activity levels, and axonal myelination and conduction velocity exhibited no adaptations. Thus, the specializations in gerbils and their absence in mice suggest an optimization of axonal and synaptic properties to the specific demands of sound localization. These findings significantly advance our understanding of structural and functional adaptations for circuit processing.

Keywords: circuit processing; input timing; myelination; sound localization; synaptic transmission delay.


Conflict of interest statement

The authors declare no conflict of interest.

Figures

Fig. 1.
Fig. 1.
Constant synaptic delays only in low-frequency-tuned, fast-conducting axons of gerbils. (A) Schematic of the mammalian sound localization circuits. Globular bushy cell (GBC) axons project to the contralateral medial nucleus of the trapezoid body (MNTB) to form one-to-one connections via the giant calyx of Held synapses. MNTB neurons then project to many brainstem and midbrain nuclei (dashed red lines), most importantly the lateral and medial superior olive (LSO and MSO, respectively) for binaural computation of sound source location: for high-frequency sounds, interaural level differences (ILDs) are analyzed in the LSO, whereas for low-frequency sounds—due to a lack of ILDs—interaural time differences (ITDs) are detected in the MSO. Both in gerbil and mouse, the MNTB is tonotopically organized with medially terminating GBC axons (light blue) tuned to higher, and laterally terminating axons (dark blue) tuned to lower frequencies. However, due to differences in the absolute hearing range (Bottom), the gerbil, but not the mouse, uses ITDs for sound localization. Typical frequency ranges of ITD and ILD processing are depicted by horizontal bars below the audiograms. (B) Representative example of sound-evoked responses of a single gerbil calyx-to-MNTB synapse/neuron (Upper trace). Below are blowups showing waveforms of the prepotential and the postsynaptic action potential to stimulus onset (pink) and to ongoing stimulus periods (purple). (C) Overlay of the waveforms recorded from a MNTB neuron tuned to low sound frequencies (CF = 800 Hz, the range where ITDs are used for sound localization), revealing identical synaptic delays (SDs) for onset (pink) and ongoing responses (purple). (D) Same display as in C for a neuron tuned to high sound frequencies (CF = 14,100 Hz), exhibiting the expected increase in SD. (E) Mean SD for onset (pink) and ongoing (purple) response plotted for each neuron recorded in the gerbil (n = 27). (F) Distribution of change in SD over the population of neurons (n = 27). Bins with stable SD (<2%) are denoted in gray. (G) The changes in SD significantly correlate (P = 0.03, Pearson correlation) with the postsynaptic MNTB neurons’ CFs. Shaded area denotes stable SDs (changes <2%). (H) Neurons with stable SD (gray) show significantly lower CFs (P = 0.02, Mann–Whitney U test). Boxes indicate interquartile range with horizontal bar showing the median. Whiskers extend to the full data range, one outlier indicated by +. (I) Neurons with stable SD (gray) also had a significantly smaller coefficient of variation (CV) for ongoing SDs (P = 0.02, Mann–Whitney U test). Conventions are as in H. (J) Changes in SD strongly depend on the mean conduction latency of the presynaptic GBC axon (P = 0.003, Pearson correlation). The correlation did not depend on the two outliers with latencies >1.4 ms (dotted line, P = 0.0002, Pearson correlation). The CFs of the postsynaptic MNTB neurons are color coded. The conduction latency was measured by electric stimulation of GBC axons (see schematic). (K and L) In neurons with SD changes <2%, conduction latencies and absolute ongoing SDs are significantly shorter (P = 0.004 and P = 0.0007, respectively, Mann–Whitney U test) than for neurons with SD changes >2%. Conventions are as in H.
Fig. S1.
Fig. S1.
Changes in synaptic delay depend on the firing rate only in gerbil, not in mice. (A) The mean firing rates of gerbil neurons with SD changes <2% tend to be lower on average (bar indicates the medians in each group, P = 0.05, Mann–Whitney U test). However, 50% of these neurons exhibit similarly high firing rates as those with SD changes >2% (firing rates >200 Hz), and the overall range of firing rates is similar in both groups. (B and C) As described before for the gerbil MNTB (24), changes in SD correlate with mean firing rate (P = 0.02, Pearson correlation, B), but firing rate does not correlate with CF (P = 0.6, Pearson correlation, C). (D and E) Across the population in mouse (n = 21), changes in SD do not correlate with mean firing rate (P = 0.32, Pearson correlation, D), and firing rate does not correlate with CF (P = 0.16, Pearson correlation, E).
Fig. 2.
Fig. 2.
Homogenous changes in synaptic delay across frequencies in mice. (A) Mean SDs for onset (pink) and ongoing (purple) responses plotted for each neuron recorded in the mouse (n = 21). (B) Distribution of change in SD over the population of neurons. Convention as in Fig. 1. (C) The changes in SD do not correlate (P = 0.85, Pearson correlation) with the postsynaptic MNTB neurons’ CFs. Shaded area denotes stable SDs (changes <2%). Only one neuron falls into this group. (D) The coefficient of variation for the ongoing SDs is similar for all neurons irrespective of their change in SD (P = 0.9, Mann–Whitney U test). Conventions are as in Fig. 1H.
Fig. 3.
Fig. 3.
Absence of structural and physiological specialization in mouse GBC axons. (A) Projections of confocal image stacks of mouse GBC axons innervating the MNTB filled with tetramethylrhodamine dextran. (Top, Left) One axon is highlighted in red and individual nodes of Ranvier are marked with yellow arrows. (Bottom, Left) Magnification of four axons; the position of juxtaparanodal (potassium Kv1.2) immunolabeled channels is shown in green. (Right) The tonotopic identity of axons was determined based on the relative position of calyces of Held along the mediolateral axis of the MNTB. (B) Schematic of the tonotopically organized MNTB (Left) and a myelinated axon illustrating the analyzed parameters (Right). (C, E, G, and I) Internodal axon diameter (C), node diameter (E), internode length (G), and internode length/internodal axon diameter (L/d) ratio (I) plotted against the distance from the heminode for lateral (GBClat, dark blue, n = 8 fibers) and medial (GBCmed, light blue, n = 5 fibers) terminating fibers. (D, F, H, and J) Averages of internodal axon diameter (D), node diameter (F), internode length (H), and L/d ratio (J) in GBCmed and GBClat fibers of mouse (Left) and gerbil (Right) (replotted from ref. 28). Data are represented as mean ± SEM. P values are derived from two-sided t tests (number of data points is given in bars). Vertical dashed line in G and I denotes beginning of steady-state section of internode length. Only steady-state values were used for calculation of the average in H and J. In stark contrast to the gerbil, no differences in axon morphology and myelination patterning between medially and laterally ending GBC fibers are present in the mouse. (K) Conduction velocity of mouse GBC fibers was measured by electrical stimulation at two different positions along the trapezoid tract (1, 2: stimulation electrodes, arrow demarks recording electrode, Left), eliciting excitatory postsynaptic currents (EPSCs) in the MNTB in vitro (blue and red EPSCs were elicited by stimulation electrodes 1 and 2, respectively, Right). (L) The mean conduction speed of GBC axons (n = 24) plotted against the mediolateral position of their terminating region in the MNTB. There is no significant correlation for mouse (black regression line), contrasting earlier findings from the gerbil (replotted from ref. in gray).

References

    1. Sun YJ, et al. Fine-tuning of pre-balanced excitation and inhibition during auditory cortical development. Nature. 2010;465:927–931. - PMC - PubMed
    1. Wehr M, Zador AM. Balanced inhibition underlies tuning and sharpens spike timing in auditory cortex. Nature. 2003;426:442–446. - PubMed
    1. Pecka M, Han Y, Sader E, Mrsic-Flogel TD. Experience-dependent specialization of receptive field surround for selective coding of natural scenes. Neuron. 2014;84:457–469. - PMC - PubMed
    1. Pouille F, Scanziani M. Enforcement of temporal fidelity in pyramidal cells by somatic feed-forward inhibition. Science. 2001;293:1159–1163. - PubMed
    1. Brand A, Behrend O, Marquardt T, McAlpine D, Grothe B. Precise inhibition is essential for microsecond interaural time difference coding. Nature. 2002;417:543–547. - PubMed

Publication types

LinkOut - more resources