. 2017 Jun 13;114(24):E4884-E4893.
doi: 10.1073/pnas.1613499114. Epub 2017 May 30.

Auxin steers root cell expansion via apoplastic pH regulation in Arabidopsis thaliana

Affiliations

Auxin steers root cell expansion via apoplastic pH regulation in Arabidopsis thaliana

Elke Barbez et al. Proc Natl Acad Sci U S A. .

Abstract

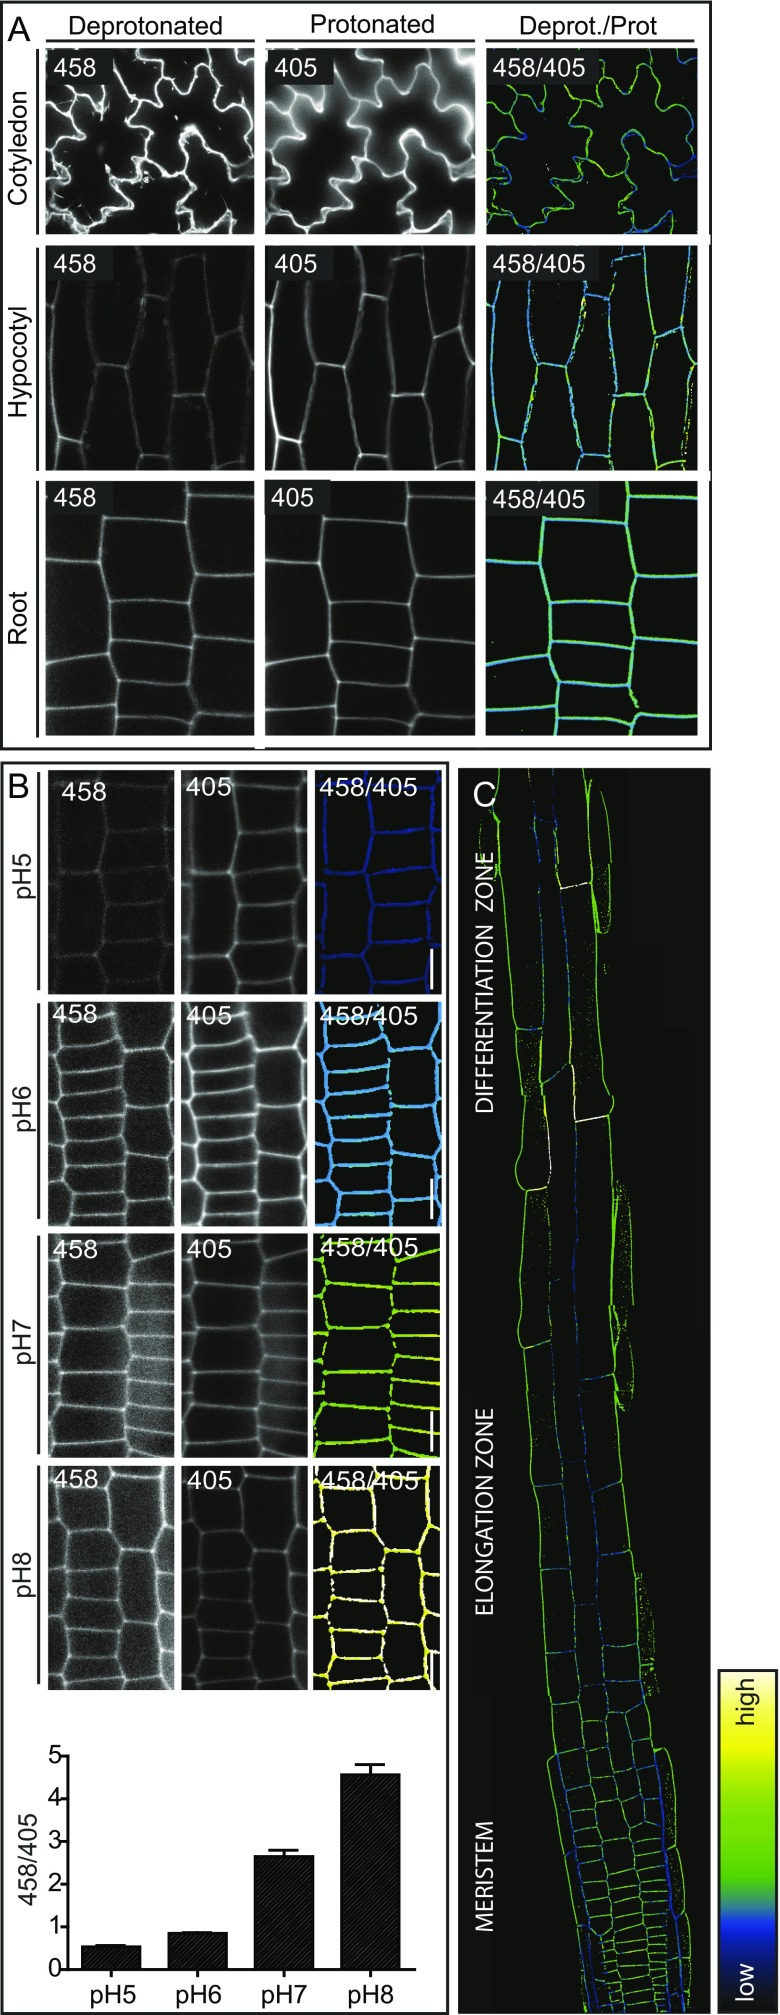
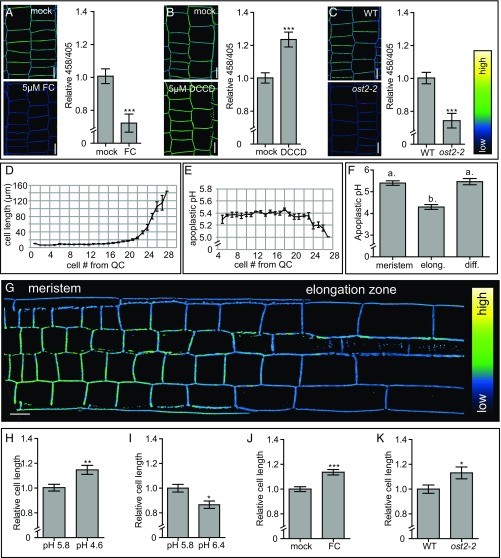
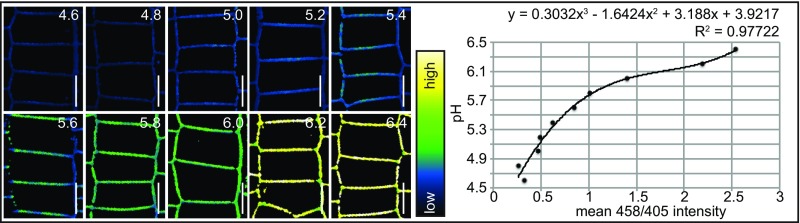
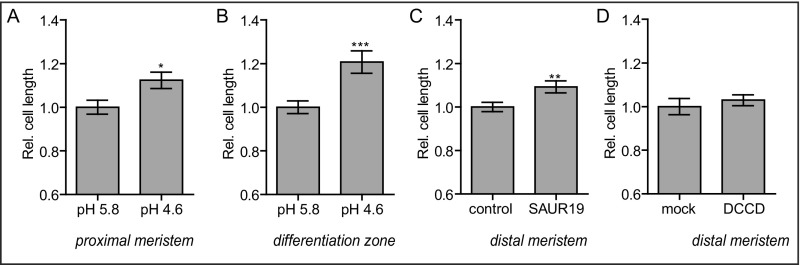
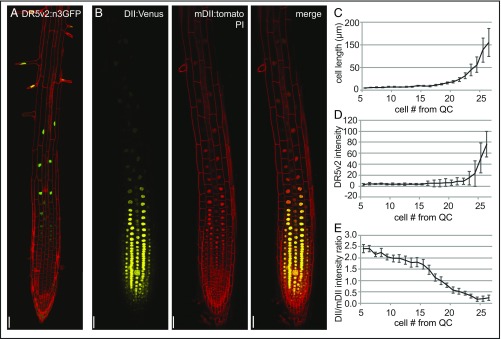
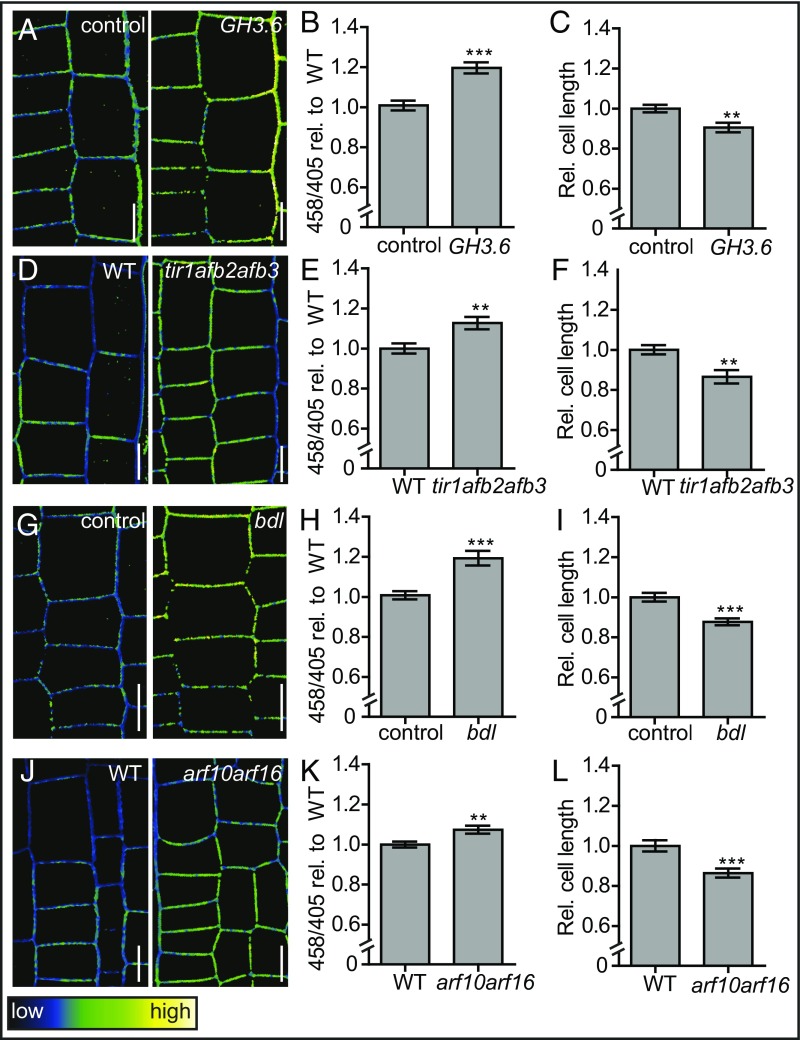
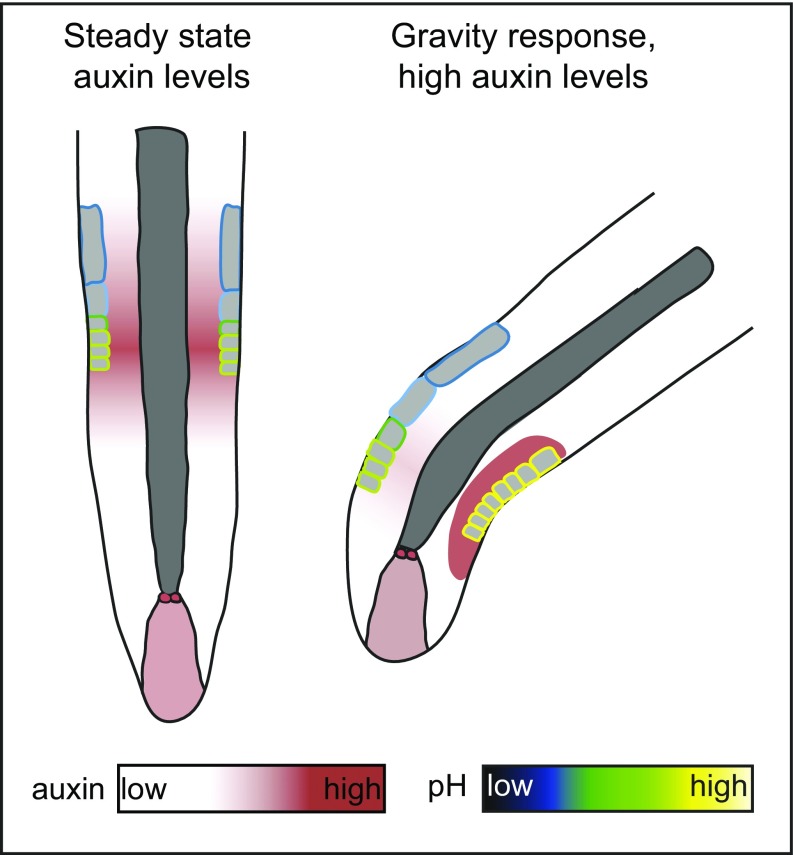
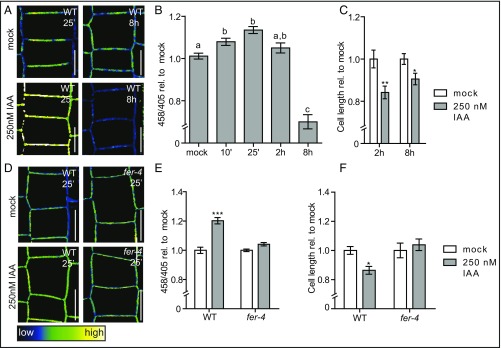
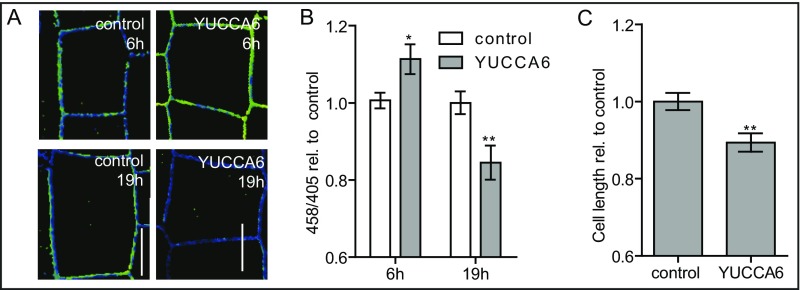
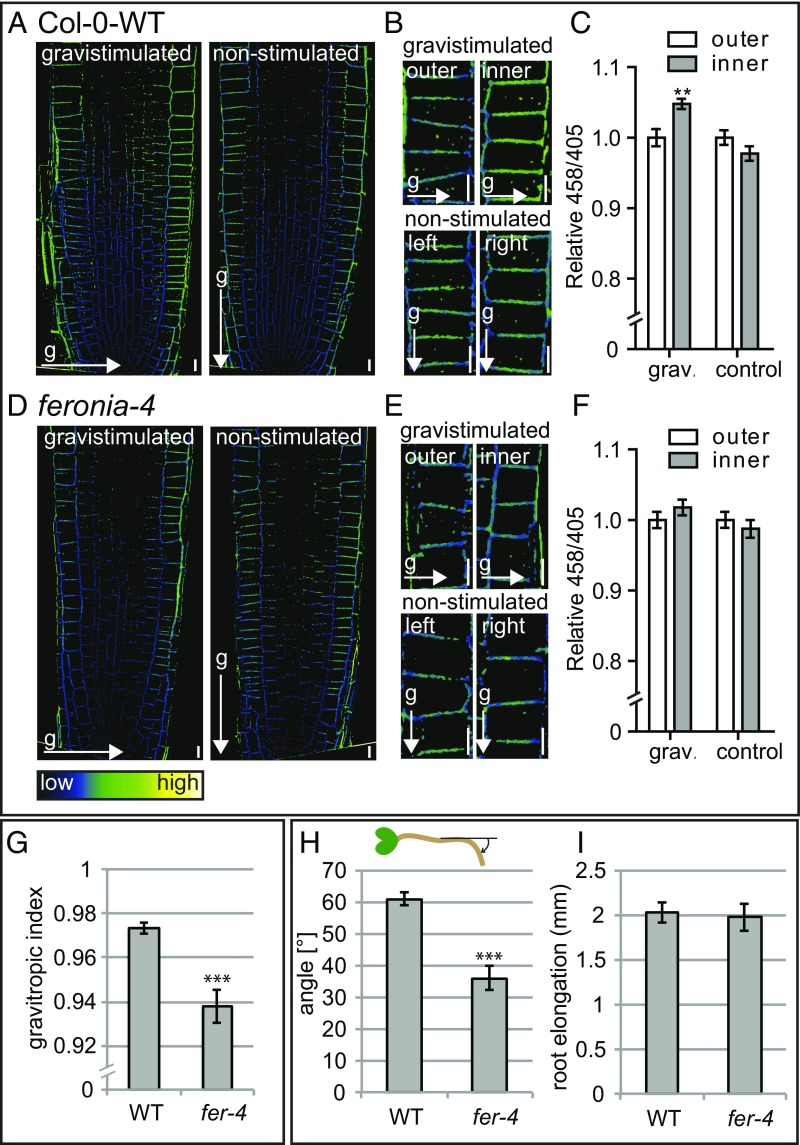
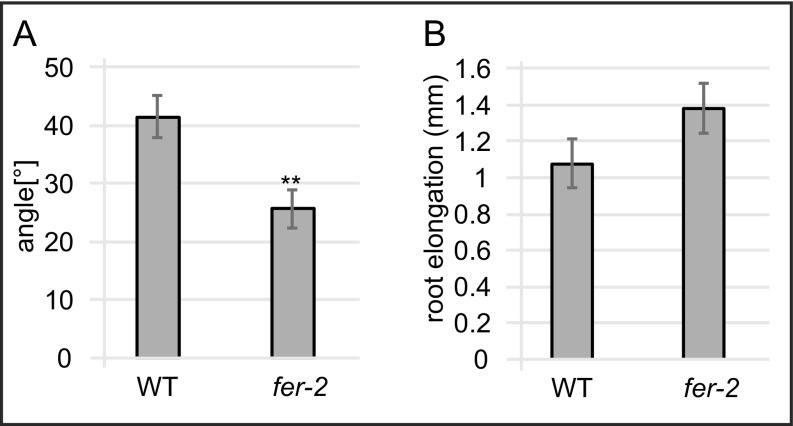
Plant cells are embedded within cell walls, which provide structural integrity, but also spatially constrain cells, and must therefore be modified to allow cellular expansion. The long-standing acid growth theory postulates that auxin triggers apoplast acidification, thereby activating cell wall-loosening enzymes that enable cell expansion in shoots. Interestingly, this model remains heavily debated in roots, because of both the complex role of auxin in plant development as well as technical limitations in investigating apoplastic pH at cellular resolution. Here, we introduce 8-hydroxypyrene-1,3,6-trisulfonic acid trisodium salt (HPTS) as a suitable fluorescent pH indicator for assessing apoplastic pH, and thus acid growth, at a cellular resolution in Arabidopsis thaliana roots. Using HPTS, we demonstrate that cell wall acidification triggers cellular expansion, which is correlated with a preceding increase of auxin signaling. Reduction in auxin levels, perception, or signaling abolishes both the extracellular acidification and cellular expansion. These findings jointly suggest that endogenous auxin controls apoplastic acidification and the onset of cellular elongation in roots. In contrast, an endogenous or exogenous increase in auxin levels induces a transient alkalinization of the extracellular matrix, reducing cellular elongation. The receptor-like kinase FERONIA is required for this physiological process, which affects cellular root expansion during the gravitropic response. These findings pinpoint a complex, presumably concentration-dependent role for auxin in apoplastic pH regulation, steering the rate of root cell expansion and gravitropic response.

Keywords: apoplastic pH; auxin; cellular expansion; root gravitropism; root growth.


Conflict of interest statement

The authors declare no conflict of interest.

Figures

Fig. S1.
Fig. S1.
(A and B) HPTS stained Col-0-WT seedlings under standard conditions (A) and incubated for 30 min in liquid growth medium of different pH (B). (Left) Deprotonated (basic) version of HPTS (λex, 458 nm; λem, 514 nm). (Middle) Protonated (acidic) version of HPTS (λex, 405 nm; λem, 514 nm). (Right) Ratiometric image where, for each pixel, the 458 intensity has been divided by the 405 intensity. The 458/405 ratio values correlate with the apoplastic pH. (C) HPTS stained 4-d-old seedling root. Color code (black to white) depicts (low to high) 458/405 intensity, and thus pH values. Error bars represent SEM.
Fig. 1.
Fig. 1.
Apoplastic pH and epidermal cell length correlation in A. thaliana roots. (A and B) The effect of 5 μM fusicoccin (FC) treatment for 60 min and 5 μM DCCD treatment for 17 h on the apoplastic pH in A. thaliana roots, visualized using HPTS staining. y-axis: mean 458/405 values of epidermal cells in root meristems of the pharmacologically treated seedlings relative to mock-treated seedlings. (C) Comparison of the apoplastic pH in WT and ost2-2 mutant seedlings, visualized by HPTS staining. y-axis: the mean 458/405 values of the ost2-2 mutant roots relative to the WT. (A–C) Error bars represent SEM (n ≥ 13 roots per line/condition). Student t test P values: *P < 0.05, **P < 0.01, ***P < 0.001. (D, E, and G) Epidermal cell length with the corresponding absolute apoplastic pH, as visualized using HPTS staining. Error bars represent SEM (n = 11 roots). (F) Apoplastic pH of the epidermal apoplast in the root meristem, elongation, and differentiation zones (Fig. S1C). Error bars represent SEM. Statistical significance (0.05%) was tested using a one-way ANOVA test with a Tukey-Kramer post hoc test (n ≥ 14 roots). (H and I) Epidermal cell length in the distal meristem of seedlings grown on pH 5.8 growth medium and transferred for 2.5 h on pH 4.6 or 6.4 growth medium. (J) The effect of 19 h of 10 μM FC treatment on the root epidermal cell length. (K) Root epidermal cell length of WT and ost2-2 seedlings. (H–K) Error bars represent SEM. (n ≥ 13 roots). Student t test P values: *P < 0.05, **P < 0.01, ***P < 0.001. (A–C and G) Color code (black to white) depicts (low to high) 458/405 intensity, and thus, pH values. (Scale bars: 10 μm.)
Fig. S2.
Fig. S2.
In vivo HPTS calibration. Apoplastic epidermal root meristem 458/405 values of seedlings incubated for 30 min in liquid growth medium with pH 4.6–6.4. x-axis: mean 458/405 value. y-axis: pH. (Top) Regression analysis derived-equation enabling apoplastic pH calculation from the obtained 458/405 values.
Fig. S3.
Fig. S3.
(A and B) Epidermal cell length (y-axis) in the proximal (early) meristem (A) and differentiation zone (B) of seedlings grown on pH 5.8 medium and transferred for 2.5 h to pH 4.6 growth medium relative to seedlings transferred on pH 5.8 growth medium. (C) Root epidermal cell length of estradiol-induced GFP-SAUR19 seedlings relative to control (empty vector) seedlings, as visualized by PI staining. (D) The effect of 17 h of 5 μM DCCD treatment on the root epidermal cell length relative to mock-treated seedlings. Error bars represent SEM. (n ≥ 24 roots per line/condition). t test P values: *P < 0.05, **P < 0.01, ***P < 0.001.
Fig. 2.
Fig. 2.
Epidermal cell-length correlation with auxin response reporter activity. (A and B) DR5v2:GFP, DII-Venus and mDII-tomato reporter activity in roots of 4-d-old Col-0-WT seedlings (n ≥ 9 roots per line). (C–E) Average epidermal cell size with the corresponding DR5v2:GFP signal intensity and DII-Venus/mDII-tomato intensity ratio. Error bars represent SEM (n = 6–9 roots per data point). (Scale bars: 50 μm.)
Fig. 3.
Fig. 3.
Apoplastic pH homeostasis in auxin signaling mutants. (AC) Apoplastic pH and corresponding epidermal cell length in estradiol-induced GH3.6 and control (empty vector) seedlings, as visualized by HPTS staining. (DF) Apoplastic pH and corresponding root epidermal cell length of WT and tir1afb2afb3 mutant seedlings, as visualized by HPTS staining. (GI) Apoplastic pH and corresponding root epidermal cell length in estradiol-induced bdl and control (empty vector) seedlings, as visualized by HPTS staining. (JL) Apoplastic pH and corresponding root epidermal cell length of WT and arf10arf16 mutant seedlings, as visualized by HPTS staining. (A, D, G, J) Color code (black to white) depicts (low to high) 458/405 intensity, and thus, pH values. Error bars represent SEM (n ≥ 19). Student t test P values: *P < 0.05, **P < 0.01, ***P < 0.001. (Scale bars: 10 μm.)
Fig. S4.
Fig. S4.
Schematic overview of a model linking auxin levels, pH, and gravity response. (Left) Apoplastic pH homeostasis in the root epidermis on steady state auxin levels. Our data show that, under steady-state auxin conditions, nuclear auxin signaling is required for apoplast acidification in the distal meristem and subsequent epidermal root cell elongation. (Right) Apoplastic pH regulation on highly increased auxin levels during a gravitropic stimulus. On gravistimulation, an auxin signaling maximum is formed at the lower side of the root (48). Our data suggest this auxin maximum results in a FERONIA-dependent transient apoplast alkalization that inhibits epidermal root cell elongation. This local inhibition of epidermal root cell elongation enables root bending toward the gravity vector.
Fig. 4.
Fig. 4.
Biphasic effect of exogenous auxin on apoplastic Ph. (AC) Effect of 250 nM exogenous IAA on apoplastic pH and root epidermal cell length, as visualized by HPTS staining. (B) The mean 458/405 intensities of seedlings treated with 250 nM IAA over time relative to mock-treated seedlings. (C) Epidermal cell length in the root of seedlings treated with 250 nM IAA for 2 h and 8 h compared with mock-treated seedlings. (DF) Effect of 250 nM IAA treatment on apoplastic pH and epidermal cell length in the root of WT and mutant seedlings, as visualized by HPTS staining. (E) Mean 458/405 intensities of WT and fer-4 seedlings treated with 250 nM IAA for 25 min relative to mock-treated seedlings. (F) Root epidermal cell length of WT and fer-4 seedlings treated with 250 nM IAA for 8 h. Color code (black to white) depicts (low to high) 458/405 intensity, and thus pH values. (B, C, E, and F) Error bars represent SEM (n ≥ 13 roots). Statistical significance was tested using a one-way ANOVA test with a Tukey-Kramer post hoc test (different letters depict statistically significant differences; P < 0.05) (B) or a two-way ANOVA test with Bonferroni posttests (treatment factor P values: *P < 0.05, **P < 0.01, ***P < 0.001) (C, E, and F). (Scale bars: 10 μm.)
Fig. S5.
Fig. S5.
(A–C) The effect of YUCCA6 induction on apoplastic pH and epidermal cell length as visualized by HPTS staining (A). The mean 458/405 intensities (y-axis) of seedlings induced with YUCCA6 for 6 h relative to control seedlings expressing an empty vector (B). Epidermal cell length (y-axis) in the root of seedlings in which YUCCA6 was induced for 19 h relative to control seedlings expressing an empty vector (C). Student t test (YUCCA6-induced compared with empty vector-induced) P values: *P < 0.05, **P < 0.01, ***P < 0.001. (Scale bars: 10 μm.) n ≥ 28 roots per line.
Fig. 5.
Fig. 5.
Effect of gravistimulation on apoplastic pH in WT and fer4 seedlings. (AF) Mean 458/405 signal intensities in the epidermal cell layer at the outer and inner side of the root of WT and fer-4 seedlings after 45 min gravistimulation (90°) compared with nonstimulated seedlings, visualized using HPTS staining. Error bars represent SEM (n = 17 roots per line). Statistical significance was tested using a two-way ANOVA test with Bonferroni posttests. Outer/inner factor P values: *P < 0.05, **P < 0.01, ***P < 0.001. (Scale bars: 10 μm.) (G) Gravitropic index (50) of 7-d-old WT and fer-4 seedlings. (H) Gravitropic response of 4-d-old seedlings gravistimulated for 6 h (90°). y-axis shows the mean angle of the root tip with respect to the horizontal (base of the root), as depicted in the schematic. (I) Root elongation of 4-d-old seedlings gravistimulated for 6 h (90°). (G–I) Error bars represent SEM (n ≥ 23 roots per line). Student t test P values: *P < 0.05, **P < 0.01, ***P < 0.001.
Fig. S6.
Fig. S6.
(A) Gravitropic response of 4-d-old fer-2 and WT seedlings gravistimulated for 6 h (90°). y-axis shows the mean angle of the root tip with respect to the horizontal (base of the root) as depicted in the schematic. (B) Root elongation of 4-d-old seedlings gravistimulated for 6 h (90°). (A and B) Error bars represent SEM. (n ≥ 26 roots per line). Student t test P values: *P < 0.05, **P < 0.01, ***P < 0.001.

References

    1. Hager A. Role of the plasma membrane H+-ATPase in auxin-induced elongation growth: Historical and new aspects. J Plant Res. 2003;116:483–505. - PubMed
    1. Rayle DL, Cleland R. Enhancement of wall loosening and elongation by Acid solutions. Plant Physiol. 1970;46:250–253. - PMC - PubMed
    1. Hager A, Menzel H, Krauss A. Versuche und Hypothese zur Primärwirkung des Auxins beim Streckungswachstum. Planta. 1971;100:47–75. - PubMed
    1. Cleland R, Haughton PM. The effect of auxin on stress relaxation in isolated Avena coleoptiles. Plant Physiol. 1971;47:812–815. - PMC - PubMed
    1. Enders TA, Strader LC. Auxin activity: Past, present, and future. Am J Bot. 2015;102:180–196. - PMC - PubMed

Publication types

MeSH terms