. 2017 Jul;174(3):1949-1968.
doi: 10.1104/pp.17.00503. Epub 2017 May 30.

Circadian, Carbon, and Light Control of Expansion Growth and Leaf Movement

Affiliations

Circadian, Carbon, and Light Control of Expansion Growth and Leaf Movement

Federico Apelt et al. Plant Physiol. 2017 Jul.

Abstract

We used Phytotyping4D to investigate the contribution of clock and light signaling to the diurnal regulation of rosette expansion growth and leaf movement in Arabidopsis (Arabidopsis thaliana). Wild-type plants and clock mutants with a short (lhycca1) and long (prr7prr9) period were analyzed in a T24 cycle and in T-cycles that were closer to the mutants' period. Wild types also were analyzed in various photoperiods and after transfer to free-running light or darkness. Rosette expansion and leaf movement exhibited a circadian oscillation, with superimposed transients after dawn and dusk. Diurnal responses were modified in clock mutants. lhycca1 exhibited an inhibition of growth at the end of night and growth rose earlier after dawn, whereas prr7prr9 showed decreased growth for the first part of the light period. Some features were partly rescued by a matching T-cycle, like the inhibition in lhycca1 at the end of the night, indicating that it is due to premature exhaustion of starch. Other features were not rescued, revealing that the clock also regulates expansion growth more directly. Expansion growth was faster at night than in the daytime, whereas published work has shown that the synthesis of cellular components is faster in the day than at nighttime. This temporal uncoupling became larger in short photoperiods and may reflect the differing dependence of expansion and biosynthesis on energy, carbon, and water. While it has been proposed that leaf expansion and movement are causally linked, we did not observe a consistent temporal relationship between expansion and leaf movement.


Figures

Figure 1.
Figure 1.
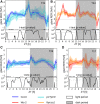
Diurnal RERs of wild-type Col-0 and Ws-2 and the lhycca1 and prr7prr9 clock mutants in T24, T17, and T28 cycles in neutral-day conditions. Photosynthetically active radiation was 160 μmol m−2 s−1, with 20°C in the light and 18°C in the dark. A and B, Diurnal RER of Col-0, Ws-2, lhycca1, and prr7prr9 in a 12-h-light/12-h-dark cycle (T24). C, Diurnal RER of Col-0 and prr7prr9 in a 14-h-light/14-h-dark cycle (T28). D, Diurnal RER of Ws-2 and lhycca1 in an 8.5-h-light/8.5-h-dark cycle (T17). Diurnal RER was averaged for each plant over all sequential T-cycles, and means and sd were computed for n ≥ 10 plants for each genotype, represented by lines and color-shaded areas, respectively, and a sliding median filter with a window of 1 h was applied (Supplemental Table S1; Supplemental Figs. S4–S7). Time is given in hours after dawn (ZT). Points above the bottom panels denote significant P values (P < 0.05) from individual Student’s t tests for differences in mean RER for nonsmoothed data (Supplemental Fig. S7), and bottom panels indicate P values from Student’s t tests applied over a 1-h sliding window, where P < 0.05 (dashed gray line) was considered significant.
Figure 2.
Figure 2.
Diurnal RERs of wild-type Col-0 and Ws-2 in a T24 cycle in SD and LD photoperiods. Photosynthetically active radiation was 160 μmol m−2 s−1, with 20°C in the light and 18°C in the dark. A, Diurnal RER in SD photoperiod with 8 h of light/16 h of dark (T24). B, Diurnal RER in LD photoperiod with 16 h of light/8 h of dark (T24). Diurnal RER was averaged for each plant over all sequential T-cycles, and means and sd were computed for n ≥ 20 plants for each genotype, represented by lines and color-shaded areas, respectively, and a sliding median filter with a window of 1 h was applied (Supplemental Table S1; Supplemental Figs. S4–S7). Time is given in hours after dawn (ZT). Points above the bottom panels denote significant P values (P < 0.05) from individual Student’s t tests for differences in mean RER for nonsmoothed data (Supplemental Fig. S7), and bottom panels indicate P values from Student’s t tests applied over a 1-h sliding window, where P < 0.05 (dashed gray line) was considered significant.
Figure 3.
Figure 3.
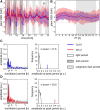
RERs of wild-type Col-0 and Ws-2 before and after the shift from a neutral-day T24 cycle to LL at 19 DAS. Photosynthetically active radiation was 160 μmol m−2 s−1, with 20°C in the light and 18°C in the dark. A, Time series of RER before and after transfer of plants to LL. B, Diurnal RER after transfer of plants to LL estimated by averaging the last three cycles in LL. C, Left, Fourier spectrum of the RER in the last three cycles in LL for Col-0 (blue) and Fourier spectra of a set of 100 shuffled RER time series, used as a null model for comparison (pale gray). Right, Quantification of the nonrandomness of periodic oscillation of RER. The blue line and gray histogram indicate peak amplitudes (arbitrary units [a.u.]) of the Fourier spectrum of the biological data and the randomized data, respectively. D, Analogous analysis as in C for Ws-2. The experiment was carried out twice, and the data were combined to calculate the RER time series, with lines representing means and color-shaded areas representing sd (n ≥ 20 plants for each genotype in each experiment).
Figure 4.
Figure 4.
Correlation-based clustering of diurnal RER patterns of wild-type and mutant plants in T24, T17, and T28 cycles in neutral-day conditions. A, Correlation of RER of lhycca1 and prr7prr9 in a T24 cycle: RER time series alignment (left) and scatter diagram of lhycca1 and prr7prr9 RERs with linear fit indicating their correlation (right). B, Correlation of RER of Col-0 in T28 and lhycca1 in T24 before rescaling (top) and after rescaling (bottom left), with RER times series alignment and a scatter diagram of rescaled Col-0 and lhycca1 RERs with linear fit indicating their correlation (bottom right). Rescaling on non-T24 data series was performed by equidistant removal of data points to adjust each time point to the same value relative to the duration of the entire light-dark cycle. C, Clustered heat map of all pairwise squared Pearson correlation coefficients (r2) between rescaled RER time series of different wild-type and mutant plants. Clustering was performed using hierarchical single-linkage clustering with a Euclidean distance measure. The number of clusters was determined using silhouette scores (Supplemental Fig. S11A), and the resulting clusters are color coded (1, red; 2, blue; 3, green; 4, black; 5, orange; 6, cyan). Time is given in hours after dawn (ZT) or, for rescaled data, as a percentage of the T-cycle length. The original time series data are shown in Figure 1 and Supplemental Figure S9. Ws2_24 and Ws2_2_24 refer to the Ws-2 data series in a 12-h-light/12-h-dark cycle in Figure 1B and Supplemental Figure S9B, respectively. For an analysis that also includes wild-type plants grown in short and long photoperiods, see Supplemental Figure S11B.
Figure 5.
Figure 5.
RERs of wild-type and mutant plants at the beginning of the light period and the beginning of the dark period, aligned to dawn and dusk. A, Diurnal RERs aligned to dawn. B, Alignment of RERs to dusk. Time is given in hours after dawn or hours after dusk. The original data are shown in Figures 1 and 2 and Supplemental Figure S9.
Figure 6.
Figure 6.
Comparison of the distribution of RER and the distribution of C deposition in structural biomass between the light period and night in wild-type Col-0 plants growing in different photoperiods. The data for RER are from Figures 1 and 2 and are summarized in Supplemental Figure S10A. The data for the deposition of C in structural biomass are from Sulpice et al. (2014), and the calculation and data are summarized in Supplemental Figure S13B. RER and C deposition in biomass are averaged across the night, the light period, or the entire 24-h cycle. A, Ratio of average RER in the light period and the night compared with the ratio of the rate of deposition of C in structural biomass in the light period and the night. Ratios are shown for Col-0 growing in LD (16- and 18-h photoperiods), neutral day (ND; 12-h photoperiod), and SD (8-h photoperiod) conditions. B, Proportion of the total daily RER and proportion of the total daily deposition of C in structural biomass that occurs at night in LD (16- and 18-h photoperiods), ND (12-h photoperiod), and SD (8-h photoperiod) conditions.
Figure 7.
Figure 7.
Diurnal hyponasty angles (HYP) of wild-type and mutant plants in different T-cycles and photoperiods. A, HYP of Col-0, Ws-2, lhycca1, and prr7prr9 in a 12-h-light/12-h-dark cycle (T24). B, HYP of Ws-2 and lhycca1 in an 8.5-h-light/8.5-h-dark cycle (T17). C, HYP of Col-0 and prr7prr9 in a 14-h-light/14-h-dark cycle (T28). D, HYP of Col-4, Ws-2, pif4pif5, and elf3 in a 12-h-light/12-h-dark cycle (T24). E, HYP of Col-0 and Ws-2 in an SD photoperiod with 8 h of light/16 h of dark (T24). F, HYP of Col-0 and Ws-2 in an LD photoperiod with 16 h of light/8 h of dark (T24). Diurnal changes in hyponasty were averaged for each plant over all sequential T-cycles, and means and sd were computed for n ≥ 10 plants for each genotype, represented by lines and color-shaded areas, respectively, and a sliding median filter with a window of 1 h was applied. Time is given in hours after dawn (ZT). The data were collected from the same experiments as the RER determinations in Figures 1 and 2 and Supplemental Figure S9.
Figure 8.
Figure 8.
Hyponasty angles (HYP) of wild-type Col-0 and Ws-2 before and after the shift from a neutral-day T24 cycle to LL at 19 DAS or DD at 18 DAS. A, HYP before and after transfer of plants to LL. B, HYP before and after transfer of plants to DD. Lines and color-shaded areas represent means and sd, respectively (n ≥ 15 plants for each genotype). Times are given as DAS.
Figure 9.
Figure 9.
Correlation-based clustering of diurnal hyponasty angles (HYP) of wild-type and mutant plants in T24, T17, and T28 cycles in neutral-day conditions and alignment of HYP time series around dusk. A, Clustered heat map of all pairwise squared Pearson correlation coefficients (r2) between rescaled hyponasty time series of different wild-type and mutant plants. For clustering analysis that also includes wild-type Col-0 and Ws-2 grown in SD and LD photoperiods, see Supplemental Figure S14. Ws2_24 and Ws2_2_24 refer to the Ws-2 data series in a 12-h-light/12-h-dark cycle in Figure 1B and Supplemental Figure S9B, respectively. Clustering was performed using hierarchical single-linkage clustering with a Euclidean distance measure. The number of clusters was determined using silhouette scores (Supplemental Fig. S14A), and the resulting clusters are color coded (1, red; 2, blue; 3, green; 4, black; 5, orange; 6, cyan). B, HYP aligned on dusk for all experiments, irrespective of the interval between dawn and dusk and the T-cycle duration. C, Change in HYP after dusk, given by the first derivative of the hyponasty time series. On average, leaf angle starts to increase 64 ± 19 min after dusk (vertical dashed-dotted line), with a maximum rate of change at 111 ± 16 min after dusk (vertical dashed line). Analogous analyses for the change in hyponasty at dawn are given in Supplemental Figure S16.

References

    1. Ache P, Bauer H, Kollist H, Al-Rasheid KA, Lautner S, Hartung W, Hedrich R (2010) Stomatal action directly feeds back on leaf turgor: new insights into the regulation of the plant water status from non-invasive pressure probe measurements. Plant J 62: 1072–1082 - PubMed
    1. Adams S, Manfield I, Stockley P, Carré IA (2015) Revised morning loops of the Arabidopsis circadian clock based on analyses of direct regulatory interactions. PLoS ONE 10: e0143943. - PMC - PubMed
    1. Alabadí D, Yanovsky MJ, Más P, Harmer SL, Kay SA (2002) Critical role for CCA1 and LHY in maintaining circadian rhythmicity in Arabidopsis. Curr Biol 12: 757–761 - PubMed
    1. Apelt F, Breuer D, Nikoloski Z, Stitt M, Kragler F (2015) Phytotyping4D: a light-field imaging system for non-invasive and accurate monitoring of spatio-temporal plant growth. Plant J 82: 693–706 - PubMed
    1. Boardman N. (1977) Comparative photosynthesis of sun and shade plants. Annu Rev Plant Physiol 28: 355–377

LinkOut - more resources