. 2017 Jun 21;37(25):6132-6148.
doi: 10.1523/JNEUROSCI.0877-17.2017. Epub 2017 May 30.

Calcineurin/NFAT Signaling in Activated Astrocytes Drives Network Hyperexcitability in Aβ-Bearing Mice

Affiliations

Calcineurin/NFAT Signaling in Activated Astrocytes Drives Network Hyperexcitability in Aβ-Bearing Mice

Pradoldej Sompol et al. J Neurosci. .

Abstract

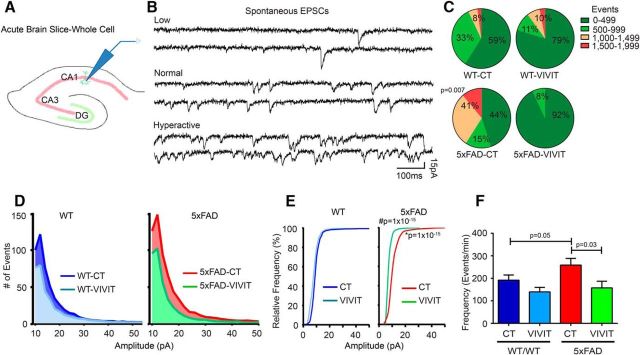
Hyperexcitable neuronal networks are mechanistically linked to the pathologic and clinical features of Alzheimer's disease (AD). Astrocytes are a primary defense against hyperexcitability, but their functional phenotype during AD is poorly understood. Here, we found that activated astrocytes in the 5xFAD mouse model were strongly associated with proteolysis of the protein phosphatase calcineurin (CN) and the elevated expression of the CN-dependent transcription factor nuclear factor of activated T cells 4 (NFAT4). Intrahippocampal injections of adeno-associated virus vectors containing the astrocyte-specific promoter Gfa2 and the NFAT inhibitory peptide VIVIT reduced signs of glutamate-mediated hyperexcitability in 5xFAD mice, measured in vivo with microelectrode arrays and ex vivo brain slices, using whole-cell voltage clamp. VIVIT treatment in 5xFAD mice led to increased expression of the astrocytic glutamate transporter GLT-1 and to attenuated changes in dendrite morphology, synaptic strength, and NMDAR-dependent responses. The results reveal astrocytic CN/NFAT4 as a key pathologic mechanism for driving glutamate dysregulation and neuronal hyperactivity during AD.SIGNIFICANCE STATEMENT Neuronal hyperexcitability and excitotoxicity are increasingly recognized as important mechanisms for neurodegeneration and dementia associated with Alzheimer's disease (AD). Astrocytes are profoundly activated during AD and may lose their capacity to regulate excitotoxic glutamate levels. Here, we show that a highly active calcineurin (CN) phosphatase fragment and its substrate transcription factor, nuclear factor of activated T cells (NFAT4), appear in astrocytes in direct proportion to the extent of astrocyte activation. The blockade of astrocytic CN/NFAT signaling in a common mouse model of AD, using adeno-associated virus vectors normalized glutamate signaling dynamics, increased astrocytic glutamate transporter levels and alleviated multiple signs of neuronal hyperexcitability. The results suggest that astrocyte activation drives hyperexcitability during AD through a mechanism involving aberrant CN/NFAT signaling and impaired glutamate transport.

Keywords: Alzheimer's disease; astrocytes; calcineurin; dementia; glutamate; hyperexcitability.


Figures

Figure 1.
Figure 1.
Astrocyte activation in 5xFAD mice is associated with increased CN/NFAT signaling. A, Representative Western blots for CN, GFAP, and GAPDH loading control in three WT and three 5xFAD mice. Full-length CN (CN-FL) is an ∼60 kDa band, and the hyperactive ΔCN fragment falls at ∼48 kDa (arrow). B–D, Mean ± SEM hippocampal protein levels [in arbitrary units (A.U.)] for CN-FL, ΔCN, and GFAP in WT (n = 15) and 5xFAD (n = 16) mice. E, Scatter plot showing the correlation between ΔCN and GFAP levels in 5xFAD mice. F, G, Confocal micrographs showing immunolabeling of GFAP and ΔCN in the dentate gyrus (F) and CA1 (G) of WT and 5xFAD mice. H, Confocal micrographs showing immunolabeling of GFAP and NFAT4 in CA1 of WT and 5xFAD mice. DAPI labeling of cell nuclei is in blue. I, J, Mean ± SEM NFAT4 labeling intensity in astrocytes (I, total) and astrocyte nuclei (J) in WT mice (n = 8) and 5xFAD mice (n = 8). NFAT4 labeling was compared across genotypes using Student's t test.
Figure 2.
Figure 2.
AAV-Gfa2-VIVIT reduces astrocytic NFAT activation and improves cognition in 5xFAD mice. A, B, Experimental treatments and timeline. Mice received intrahippocampal injections of AAV-Gfa2-EGFP control or AAV-Gfa2-VIVIT-EGFP at 1.5–2 months of age. Behavioral, glutamate signaling, and/or electrophysiology endpoint measures were collected at 6–8 months of age. C, Transverse hippocampal section from an AAV-Gfa2-EGFP-treated mouse at 8 months of age showing extensive EGFP labeling. D, Confocal micrographs of EGFP (green), NFAT4 (red), and DAPI in 5xFAD mice treated with AAV-Gfa2-EGFP or AAV-Gfa2-VIVIT-EGFP. Left panels are 2-D confocal micrographs, and right panels are 3-D reconstructed images of ∼15 μm z-stacks (0.5 μm sections). E, Mean ± SEM NFAT4 activity levels (ratio of nuclear NFAT4 to total NFAT4 labeling) in EGFP-positive astrocytes of 5xFAD mice treated with AAV-Gfa2-EGFP (n = 6) or AAV-Gfa2-VIVIT-EGFP (n = 6). Nuclear NFAT4 levels were compared across AAV treatment groups using Student's t test. F, G, Mean ± SEM error rate (percentage of total errors on block 1) on the 2 d RAWM task in WT mice (F) and 5xFAD mice (G) treated with AAV-Gfa2-EGFP (CT) or AAV-Gfa2-VIVIT-EGFP. Genotype and AAV treatment effects on learning rates were determined with ANOVA and Fisher's LSD test. H, Mean ± SEM total errors committed on days 1 and 2 of the RAWM task. WT-CT group, 28 mice/group; WT-VIVIT group, 15 mice/group; 5xFAD-CT group, 22 mice/group; 5xFAD-VIVIT group, 10 mice/group. Genotype, AAV, and training day effects (along with significant interactions) were determined with a three-way rmANOVA and follow-up one-way rmANOVAs within each experimental group.
Figure 3.
Figure 3.
AAV-Gfa2-VIVIT normalizes spontaneous glutamate transients in 5xFAD mice in vivo. A, B, Self-referencing MEAs were used to measure glutamate transients in CA1 of anesthetized WT and 5xFAD mice treated with AAV-Gfa2-EGFP (CT) or AAV-Gfa2-VIVIT-EGFP. A micrograph of the MEA is shown in A. Glutamate-sensing sites were coated with glutamate oxidase (GluOx). “Sentinel” indicates self-referencing sites (for details, see Materials and Methods). C, Hippocampus of a WT-CT mouse labeled with cresyl violet to confirm MEA localization to CA1 stratum radiatum (red arrowhead). D, Mean ± SEM basal glutamate levels in WT and 5xFAD mice under CT and VIVIT conditions. n.s. = nonsignificant. WT-CT group, 10 mice/group; WT-VIVIT group 4 mice/group; 5xFAD-CT group, 8 mice/group; 5xFAD-VIVIT group, 5 mice/group. E, Representative traces of spontaneous glutamate transients in WT and 5xFAD mice. Inset is a higher-magnification view of a single transient. F, G, Mean ± SEM frequency (F) and amplitude (G) of glutamate transients across treatment groups. H, Parameters for measuring glutamate transient duration. Representative transients in 5xFAD-CT and 5xFAD-VIVIT mice are shown. Transients were matched for maximum amplitude then were fit with nonlinear Lorentzian functions (dotted line). Relative glutamate levels are indicated along the descending limb when transients fell to 50% (T50), 20% (T80), and 0% (T100) of the maximum amplitude. I, Transient duration expressed as the time at which T50, T80, and T100 thresholds were reached (mean ± SEM; see H) in each group. Time is relative to the peak glutamate transient amplitude. Genotype and AAV effects in D, F, G, and I were determined with ANOVA and Fisher's LSD test.
Figure 4.
Figure 4.
AAV-Gfa2-VIVIT-EGFP reduces Aβ levels and increases GLT-1 labeling in 5xFAD mice. A, Confocal micrographs of CA1 in CT- and VIVIT-treated 5xFAD mice showing immunolabeling of Aβ (red) and GFAP (blue). B–D, Mean ± SEM Aβ plaque load (B), Aβ peptide levels (C), and GFAP labeling (volume-μm3; D) in CA1 of AAV-treated 5xFAD mice. 5xFAD-CT group, 6 mice/group; 5xFAD-VIVIT group, 7 mice/group. E, F, 3-D reconstructions of GLT-1 labeling (blue) in hippocampal area CA1. Aβ deposits are shown in red at low (E) and high (F) magnification. G, H, Mean ± SEM GLT-1 labeling intensity [arbitrary units (A.U.)/tissue volume-μm3) across total hippocampus (G) and in the immediate vicinity (H) of Aβ deposits of AAV-treated 5xFAD mice. I, J, Representative Western blots (I) and mean ± SEM hippocampal protein levels (J, in A.U.) for GLT-1 in CT mice and VIVIT-treated 5xFAD mice. (n = 3/group). K, Fluorescent (Fluo) and phase contrast micrographs of a whole-cell patch micropipette sealed to a primary astrocyte infected with adenovirus expressing ΔCN-DsRed2. L, Representative inward currents recorded in primary astrocytes (voltage clamped to −70 mV) during extracellular perfusion with 10 μm l-glutamate. Treatment conditions: CT (Ad-CMV-LacZ-GFP), ΔCN (Ad-CMV-ΔCN-DsRed); VIVIT (Ad-CMV-VIVIT-EGFP); and TBOA (glutamate transporter inhibitor). M, Mean ± SEM glutamate-mediated inward current density (pA/pF) in astrocytes treated with control adenovirus (Ad-LacZ) or with adenovirus expressing ΔCN and VIVIT. CT group, 8 cells/group; ΔCN group, 9 cells/group; VIVIT group, 4 cells/group. AAV effects in B–D and G–J were determined with Student's t test. Adenovirus treatment effects in M were determined with ANOVA and Fisher's LSD test.
Figure 5.
Figure 5.
AAV-Gfa2-VIVIT-EGFP quells synaptic hyperexcitability in 5xFAD mice. A, Schematic illustration showing whole-cell voltage-clamp recordings from individual CA1 neurons in ex vivo brain slices. B, Representative traces showing spontaneous EPSCs recorded from CA1 neurons held at −80 mV. Traces are from cells that showed low, normal, and high (hyperactive) levels of spontaneous synaptic activity. C, Pie charts of the percentage of cells in each treatment group sorted by activity levels (i.e., number of EPSCs) during the 3 min recording window: low (0–499, dark green), low-normal (500–999, light green); high-normal (1000–1499, yellow), and high (>1500, red). The proportion of cells at each activity level was compared across genotype/AAV groups using Fisher's exact test. D, Mean EPSC amplitude histograms from WT (left) and 5xFAD mice (right) treated with AAV-Gfa2-EGFP (CT) or AAV-Gfa2-VIVIT-EGFP (VIVIT). E, Mean cumulative frequency distributions for WT mice (left) and 5xFAD mice (right) under CT and VIVIT treatment conditions. Significant shifts in the frequency distributions between 5xFAD-CT vs WT-CT cells (*) and 5xFAD-VIVIT vs 5xFAD-CT cells (#) were determined using the Kolmogorov–Smirnov test. F, Mean ± SEM EPSC frequency (events/min) in AAV-treated WT and 5xFAD mice. WT-CT group, 39 cells from 16 mice; WT-VIVIT group, 28 cells from 10 mice; 5xFAD-CT group, 33 cells from 11 mice; 5xFAD-VIVIT group, 14 cells from 7 mice. Genotype and AAV effects in F were determined with ANOVA and Fisher's LSD test.
Figure 6.
Figure 6.
AAV-Gfa2-VIVIT-EGFP reduces dendritic degeneration and population synaptic deficits in 5xFAD mice. A, Photomicrographs showing NeuN immunolabeling in hippocampus of a WT mouse. Left panel is a low-power micrograph of the CA1 pyramidal cell layer. The right panel shows a high-power micrograph of CA1. B, Mean ± SEM CA1 neuron count in AAV-treated WT and 5xFAD mice (CT and VIVIT). n.s., Nonsignificant. WT-CT group, 9 mice/group; WT-VIVIT group, 7 mice/group; 5xFAD-CT group, 11 mice/group; 5xFAD-VIVIT group, 6 mice/group. C, High-power fluorescent photomicrographs of MAP2 immunolabeling in CA1 pyramidal neurons and apical dendrites from AAV-treated WT and 5xFAD mice. In the 5xFAD-CT panel, dendrites are clearly swollen (yellow arrow) or atrophied (yellow arrowheads). D, Mean Gaussian distributions of dendrite diameters in AAV-treated WT mice and 5xFAD mice (n = 6/group). Significant shifts in the dendrite diameter distributions between the 5xFAD-CT and WT-CT groups (*) and 5xFAD-VIVIT vs 5xFAD-CT groups (#) were determined using the Kolmogorov–Smirnov test. E, F, Synaptic strength curves in WT mice (E) and 5xFAD mice (F) shown as the mean ± SEM field EPSP slope amplitudes (vertical error bars) plotted against the mean ± SEM FV amplitudes (horizontal error bars) across 12 stimulus intensities. Insets, Representative field potentials recorded from each treatment condition. Within each genotype, waveforms are matched to similar FV amplitudes. Calibration: 0.5 mV, 5 ms. G, Mean ± SEM maximal EPSP to FV ratio in AAV-treated WT mice and 5xFAD mice. (H) Mean ± SEM PS threshold in AAV-treated WT and 5xFAD mice. The PS threshold is defined as the EPSP slope measured during the first appearance of a PS in the ascending limb of the field potential. Inset, Representative field potential from a 5xFAD-CT mouse. Arrow points to an upward-going PS in the ascending limb of the field potential. Calibration: 0.5 mV, 5 ms. For E–H: WT-CT group, 10 mice/group; WT-VIVIT group, 9 mice/group; 5xFAD-CT group, 11 mice/group; 5xFAD-VIVIT group, 8 mice/group. For B and E–H, genotype and AAV treatment effects were determined with ANOVA and Fisher's LSD test.
Figure 7.
Figure 7.
AAV-Gfa2-VIVIT-EGFP normalizes NMDAR activation in 5xFAD mice but does not affect the appearance of functionally silent synapses. A, Time plot of EPSCs recorded from a CA1 pyramidal neuron in response to minimal electrical stimulation of CA3 Schaffer collaterals. EPSCs were downward going when the cell was voltage clamped to −80 mV but were outward-going when the holding potential was switched to +40 mV. Application of the NR2B inhibitor Ro-25-6981 (0.5 μm) reduced the amplitude of outward-going EPSCs, confirming that these events included a strong NMDAR-dependent component. B, Representative EPSCs recorded at −80 mV (inward-going currents) and +40 mV (outward-going currents) in AAV-treated WT and 5xFAD mice. C, Mean ± SEM EPSC amplitudes recorded at −80 mV (inward) and +40 mV (outward) in AAV-treated WT and 5xFAD mice. WT-CT group, 16 cells from 15 mice; WT-VIVIT group, 10 cells from 9 mice; 5xFAD-CT group, 16 cells from 11 mice; 5xFAD-VIVIT, 9 cells from 7 mice. D, Change in the synaptic transmission failure rate (%) in individual cells held at −80 vs +40 mV from AAV-treated WT and 5xFAD mice. E, Mean ± SEM change in the failure rate in cells held at −80 vs +40 mV from AAV-treated WT and 5xFAD mice. F–I, Time plots and bar graphs illustrate genotype/AAV differences in isolated NMDAR potentials. Time plots in F and H show normalized field EPSP recordings during washin of CNQX, picrotoxin, and the NR2A blocker PPPA to isolate NR2B EPSPs (F) or CNQX, picrotoxin, and the NR2B blocker Ro-25-6981 to isolate NR2A EPSPs (H). Bar graphs show the mean ± SEM amplitude of NR2B (G) and NR2A (I) EPSPs (measured at time point 2 in F and H) as a proportion (%) of the corresponding drug-free EPSP (measured at time point 1 in F and H). WT-CT group, 11 mice/group; WT-VIVIT group, 10 mice/group; 5xFAD-CT group, 12 mice/group; 5xFAD-VIVIT group, 10 mice/group. F, H, Insets, Representative field potentials recorded before (1) and after (2) drug washin. Calibration: 1 mV, 5 ms. For C, G, and I, genotype and AAV treatment effects were determined with ANOVA and Fisher's LSD test. For E, genotype and AAV treatment effects were determined with rmANOVA and Fisher's LSD test.

Similar articles

Cited by

References

    1. Abdul HM, Sama MA, Furman JL, Mathis DM, Beckett TL, Weidner AM, Patel ES, Baig I, Murphy MP, LeVine H 3rd, Kraner SD, Norris CM (2009) Cognitive decline in Alzheimer's disease is associated with selective changes in calcineurin/NFAT signaling. J Neurosci 29:12957–12969. 10.1523/JNEUROSCI.1064-09.2009 - DOI - PMC - PubMed
    1. Aida T, Ito Y, Takahashi YK, Tanaka K (2012) Overstimulation of NMDA receptors impairs early brain development in vivo. PLoS One 7:e36853. 10.1371/journal.pone.0036853 - DOI - PMC - PubMed
    1. Alamed J, Wilcock DM, Diamond DM, Gordon MN, Morgan D (2006) Two-day radial-arm water maze learning and memory task; robust resolution of amyloid-related memory deficits in transgenic mice. Nat Protoc 1:1671–1679. 10.1038/nprot.2006.275 - DOI - PubMed
    1. Andreasson KI, Bachstetter AD, Colonna M, Ginhoux F, Holmes C, Lamb B, Landreth G, Lee DC, Low D, Lynch MA, Monsonego A, O'Banion MK, Pekny M, Puschmann T, Russek-Blum N, Sandusky LA, Selenica ML, Takata K, Teeling J, Town T, et al. (2016) Targeting innate immunity for neurodegenerative disorders of the central nervous system. J Neurochem 138:653–693. 10.1111/jnc.13667 - DOI - PMC - PubMed
    1. Andrew RD, MacVicar BA (1994) Imaging cell volume changes and neuronal excitation in the hippocampal slice. Neuroscience 62:371–383. 10.1016/0306-4522(94)90372-7 - DOI - PubMed

Publication types

MeSH terms

LinkOut - more resources