. 2017 Jun 28;37(26):6342-6358.
doi: 10.1523/JNEUROSCI.0444-17.2017. Epub 2017 May 30.

Axonal Conduction Delays, Brain State, and Corticogeniculate Communication

Affiliations

Axonal Conduction Delays, Brain State, and Corticogeniculate Communication

Carl R Stoelzel et al. J Neurosci. .

Abstract

Thalamocortical conduction times are short, but layer 6 corticothalamic axons display an enormous range of conduction times, some exceeding 40-50 ms. Here, we investigate (1) how axonal conduction times of corticogeniculate (CG) neurons are related to the visual information conveyed to the thalamus, and (2) how alert versus nonalert awake brain states affect visual processing across the spectrum of CG conduction times. In awake female Dutch-Belted rabbits, we found 58% of CG neurons to be visually responsive, and 42% to be unresponsive. All responsive CG neurons had simple, orientation-selective receptive fields, and generated sustained responses to stationary stimuli. CG axonal conduction times were strongly related to modulated firing rates (F1 values) generated by drifting grating stimuli, and their associated interspike interval distributions, suggesting a continuum of visual responsiveness spanning the spectrum of axonal conduction times. CG conduction times were also significantly related to visual response latency, contrast sensitivity (C-50 values), directional selectivity, and optimal stimulus velocity. Increasing alertness did not cause visually unresponsive CG neurons to become responsive and did not change the response linearity (F1/F0 ratios) of visually responsive CG neurons. However, for visually responsive CG neurons, increased alertness nearly doubled the modulated response amplitude to optimal visual stimulation (F1 values), significantly shortened response latency, and dramatically increased response reliability. These effects of alertness were uniform across the broad spectrum of CG axonal conduction times.SIGNIFICANCE STATEMENT Corticothalamic neurons of layer 6 send a dense feedback projection to thalamic nuclei that provide input to sensory neocortex. While sensory information reaches the cortex after brief thalamocortical axonal delays, corticothalamic axons can exhibit conduction delays of <2 ms to 40-50 ms. Here, in the corticogeniculate visual system of awake rabbits, we investigate the functional significance of this axonal diversity, and the effects of shifting alert/nonalert brain states on corticogeniculate processing. We show that axonal conduction times are strongly related to multiple visual response properties, suggesting a continuum of visual responsiveness spanning the spectrum of corticogeniculate axonal conduction times. We also show that transitions between awake brain states powerfully affect corticogeniculate processing, in some ways more strongly than in layer 4.

Keywords: alert brain state; corticothalamic; lateral geniculate nucleus; layer 6; neocortical axons; visual cortex.


Conflict of interest statement

The authors declare no competing financial interests.

Figures

Figure 1.
Figure 1.
Depth distribution of antidromically identified CG neurons. A, An example of the flash-evoked field potentials recorded from V1 using a 16-channel silicone probe (vertical spacing, 100 μm). The reversal point for these field potentials is the fifth channel from the top. Brackets indicate the estimated position of L4. In this penetration, antidromically identified CG neurons (see Materials and Methods) were recorded on channels 13–15 (800–1000 μm beneath the flash reversal point) with the following antidromic latencies: *a = 20 ms. *b = 3.5 ms and 33 ms. *c = 23 ms. B, The frequency distribution of depths for the first antidromically identified CG neurons (black bars) in each penetration with respect to the flash reversal point. The relative depth of antidromically identified corticotectal neurons (green bars, taken from Bereshpolova et al., 2007), obtained using the same methods, is provided for reference.
Figure 2.
Figure 2.
CG neurons exhibited a very wide range of axonal conduction times. A1, Frequency distribution of antidromic latencies for visually responsive CG neurons (black bars), CG neurons that were unresponsive to visual stimulation (gray bars), and CG neurons that were not visually tested (white bars). A2, Means for these subgroups of CG cells. A3, For comparative purposes, frequency distribution of the antidromic latencies of LGN thalamocortical neurons in rabbit (from Swadlow and Weyand, 1985). B, Frequency distribution of spontaneous firing rates for visually responsive and unresponsive CG neurons and, for comparative purposes, for the corticotectal neurons shown in Figure 1B (from Bereshpolova et al., 2007). Note the nearly nonoverlapping distributions of these populations. Inset, Mean ± SEM for these groups of cells, along with the values for the L5 corticotectal neurons.
Figure 3.
Figure 3.
Representative RF properties of short-, medium-, and long-latency CG neurons. A–C, RF maps, plotted using reverse correlation (red represents ON; blue represents OFF responses), and the orientation/direction, spatial frequency, contrast tuning, and temporal frequency tuning curves for three example CG neurons, with short (3.0 ms), medium (14.8 ms), and long (35.0 ms) antidromic latencies.
Figure 4.
Figure 4.
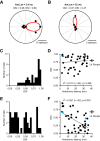
CG neurons with fast-conducting axons are more responsive to visual stimuli. A, B, PSTHs for two example CG neurons during optimal drifting grating stimulation at the preferred orientation, temporal frequency, and spatial frequency. These neurons had antidromic latencies of 3.4 ms (A, F1 = 38.1 spikes/s) and 32 ms (B, F1 = 4.2 spikes/s) and are the same example neurons presented (below) at the top of Figures 5–9, and in the scattergrams (blue dots) in Figures 4–10, 13, 14. Frequency distribution of F0 (C) and F1 (E) amplitude observed during optimal stimulation for all visually responsive CG neurons. D, F, Relationship between maximal F0 (D) and F1 (F) during optimal visual stimulation for visually responsive CG neurons and antidromic latency. Visual responsiveness was significantly related to antidromic latency for both F0 (p < 0.001) and F1 (p < 0.001). G, Frequency distribution of F1/F0 ratio for all visually responsive CG neurons. H, Relationship between F1/F0 ratio values and antidromic latency for all visually responsive CG neurons. D, F, H, For comparative purposes, horizontal bar (to right of scattergrams) represents mean ± SE values for F0, F1, and F1/F0 ratios, respectively, for L4 simple cells of awake rabbit V1 (from Zhuang et al., 2013).
Figure 5.
Figure 5.
CG neurons with fast-conducting axons have shorter visually driven and electrically elicited interspike intervals. A, B, The interspike interval distribution obtained during optimal drifting grating stimulation for the fast-conducting (A) and slow-conducting (B) CG neurons seen in Figure 4A, B, respectively. Blue arrows indicate minimal interspike interval. C, Frequency distribution for minimal interspike interval values observed during optimal grating stimulation. Inset, Relationship between the F1 value (reciprocal) for each CG neuron and the minimal interspike interval. D, The relationship between antidromic latency and minimal interspike interval during optimal drifting grating stimulation for visually responsive CG neurons. E, Frequency distribution for minimal interspike interval values observed (via recordings near the cell body) following paired electrical stimulation near the axon terminal within the LGN. F, The relationship between antidromic latency and minimal interspike interval following paired electrical stimulation.
Figure 6.
Figure 6.
CG neurons with fast-conducting axons have shorter visual response latencies than CG neurons with slow-conducting axons. A, B, PSTHs to flashing (2 s on, 2 s off) visual stimuli (for the same two example CG neurons shown in Figs. 4, 5A,B) showing the first 200 ms after stimulus onset. Blue arrows indicate response latency. C, Frequency distribution of the response latency to flashing stimuli as measured from the PSTH for visually responsive CG neurons. D, Relationship between antidromic latency and visual response latency to flash for visually responsive CG neurons. Right, Horizontal bar represents mean ± SE for visual response latency for L4 simple cells of awake rabbit V1 (from Zhuang et al., 2013).
Figure 7.
Figure 7.
CG neurons with fast-conducting axons respond better to lower contrast or faster moving stimuli than CG neurons with slowly conducting axons. A–D, Contrast response functions were obtained and fit with a hyperbolic model (see Materials and Methods). A, B, Contrast response functions for the two example visually responsive CG neurons (the same fast and slow CG neurons as shown in Figs. 4–6). Blue arrows indicate C-50 values. C, Frequency distribution of C-50 values for visually responsive CG neurons. D, Relationship between antidromic latency and C-50 for visually responsive CG neurons. E–H, Temporal frequency tuning was measured by testing grating speeds between 0.5 and 20 Hz, and responses were fit with a Gaussian function. E, F, Example temporal tuning functions for the two example visually responsive CG neurons. Blue arrows indicate peak temporal frequencies. G, Frequency distribution of peak temporal frequencies for visually responsive CG neurons. H, Relationship between antidromic latency and peak temporal frequency for visually responsive CG neurons. D, H, Right, Horizontal bars represent mean ± SE for C-50 and peak temporal frequency values for L4 simple cells of awake rabbit V1 (from Zhuang et al., 2013).
Figure 8.
Figure 8.
Fast and slow CG neurons show similar orientation tuning, but fast-conducting CG neurons are more directionally selective. A–D, Orientation tuning curves were obtained and fit with a von Mises function (see Materials and Methods). A, B, Orientation tuning curves for our example fast-conducting (antidromic latency = 3.4 ms) and slowly conducting (antidromic latency = 32 ms) CG cell. C, Frequency distribution of OSI values for visually responsive CG neurons. D, Relationship between antidromic latency and OSI values. E, Frequency distribution of DSI values for these cells. F, Relationship between antidromic latency and DSI values. D, F, Right, Horizontal bar represents mean ± SE for OSI/DSI values for L4 simple cells of awake rabbit V1 (from Zhuang et al., 2013).
Figure 9.
Figure 9.
All CG neurons responded in a sustained manner to a maintained stationary flashing visual stimulus. A, B, PSTHs (insets, raster plots) showing response to a stationary optimal flashing stimulus presented over the RF center from the two example visually responsive CG neurons (the same fast and slow CG neurons shown in Figs. 4–8). C, Mean PSTH calculated from population of CG neurons, normalized to the peak amplitude of the transient component. Shaded area represents mean ± SEM for each bin. D, Relationship between antidromic latency and the “sustained index,” a measure of the amplitude of the sustained response (see Materials and Methods). E, Relationship between antidromic latency and the “transient/sustained ratio” (see Materials and Methods). F, PSTHs of the population responses of CG neurons, measured in both alert (red) and nonalert (blue) states. Data from each cell are normalized to the peak amplitude of the transient component of the response when alert. The transient component is little affected by brain state, but the sustained component is strongly depressed when nonalert.
Figure 10.
Figure 10.
Spatial frequency preference and response reliability are not related to CG antidromic latency. A, Frequency distribution of preferred spatial frequencies for visually responsive CG neurons. B, Relationship between antidromic latency and preferred spatial frequency. C, Frequency distribution of Fano factor values. D, Relationship between antidromic latency and Fano factor. B, D, Right, Horizontal bar represents mean and SE for spatial frequency and Fano factor values for L4 simple cells of awake rabbit V1 (from Zhuang et al., 2013).
Figure 11.
Figure 11.
Depth within L6, CG visual responsiveness, and antidromic latency. A, Relationship between the depth within L6 and antidromic latency of visually responsive and visually unresponsive CG neurons. B, Strong relationship between antidromic latency and maximal responding to optimal visual stimulation of CG neurons within the superficial 400 μm of L6 (B bracket in A, from −800 to −1200 μm in depth). C, Conversely, long-latency CG neurons (C bracket in A, 22+ ms) have very low F1 response rates regardless of their depth in L6.
Figure 12.
Figure 12.
Responses to optimal drifting gratings of an L6 CG neuron during alert/nonalert transitions. One transition from the alert state to the nonalert state and PSTHs around transition points [from ∼5 s alert (red) to ∼5 s nonalert (blue)] are shown. Top to bottom, Visual stimulus (time in x-axis and luminance in y-axis), cell spike rasters, snap shots extracted from the video recording of the eye (1 per second), and hippocampal (Hipp) and cortical (Ctx) EEG are shown.
Figure 13.
Figure 13.
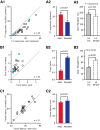
Alertness increases F1 responses, response reliability, and decreases visual response latency of L6 CG neurons. A1, Scattergram of F1 responses for each cell in the two states. A2, Population statistics of state effect on F1 responses. A3, Left, The same data presented in A1, plotted as the mean F1 response in the alert state, relative to the F1 when nonalert. A3, Right, The same measure, but for L4 simple cells (L4 data derived from data in Zhuang et al., 2014). B1, Scattergram of Fano factor values for each cell in the two states. B2, Population statistics for state effects on Fano factor values. B3, Left, The same data presented in B1, plotted as the mean Fano factor in the alert state, relative to the Fano factor when nonalert. B3, Right, The same measure, but for L4 simple cells (L4 data from Zhuang et al., 2014). C1, Scattergram of visual latencies for each cell in the two states. C2, Population statistics of state effect on visual latency.
Figure 14.
Figure 14.
Lack of interaction between effects of brain state and effects of axonal conduction time on CG visual response properties. Regardless of the CG antidromic latency, F1 responses (A) were greater when alert, Fano factor (B) and visual latency (C) were reduced when alert, sustained responding (the Sustained Index) (D) was increased when alert, and the Transient/Sustained ratio (E) was reduced when alert.

Similar articles

Cited by

References

    1. Albrecht DG, Hamilton DB (1982) Striate cortex of monkey and cat: contrast response function. J Neurophysiol 48:217–237. - PubMed
    1. Alitto HJ, Usrey WM (2003) Corticothalamic feedback and sensory processing. Curr Opin Neurobiol 13:440–445. 10.1016/S0959-4388(03)00096-5 - DOI - PubMed
    1. Alonso JM, Usrey WM, Reid RC (2001) Rules of connectivity between geniculate cells and simple cells in cat primary visual cortex. J Neurosci 21:4002–4015. - PMC - PubMed
    1. Beierlein M, Connors BW (2002) Short-term dynamics of thalamocortical and intracortical synapses onto layer 6 neurons in neocortex. J Neurophysiol 88:1924–1932. - PubMed
    1. Beloozerova IN, Sirota MG, Swadlow HA (2003) Activity of different classes of neurons of the motor cortex during locomotion. J Neurosci 23:1087–1097. - PMC - PubMed

Publication types

LinkOut - more resources