. 2017 Jun 21;37(25):6149-6161.
doi: 10.1523/JNEUROSCI.0397-17.2017. Epub 2017 May 30.

A Role for Auditory Corticothalamic Feedback in the Perception of Complex Sounds

Affiliations

A Role for Auditory Corticothalamic Feedback in the Perception of Complex Sounds

Natsumi Y Homma et al. J Neurosci. .

Abstract

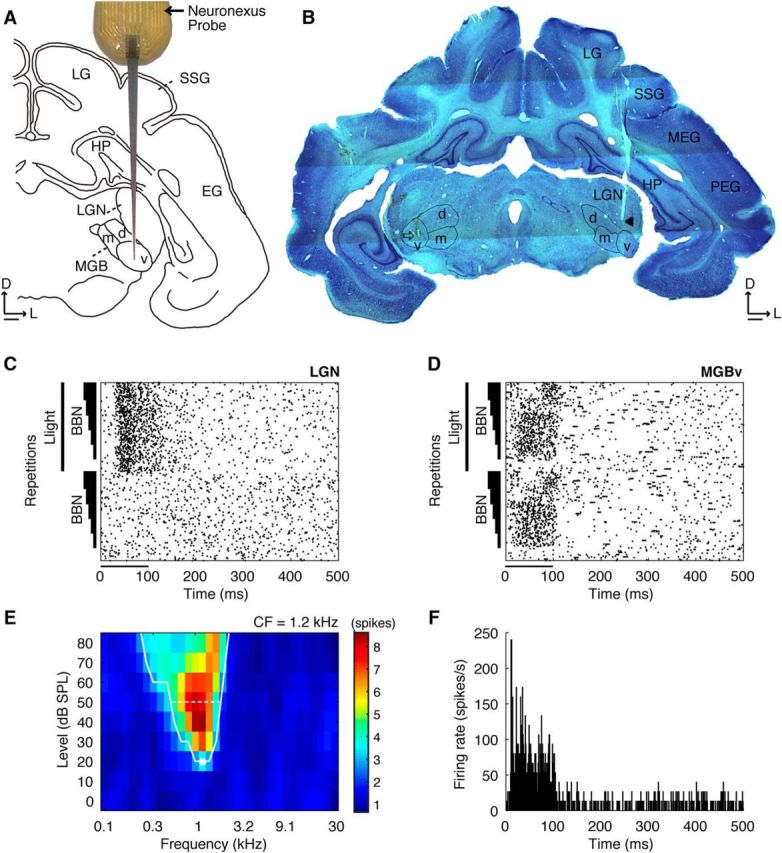
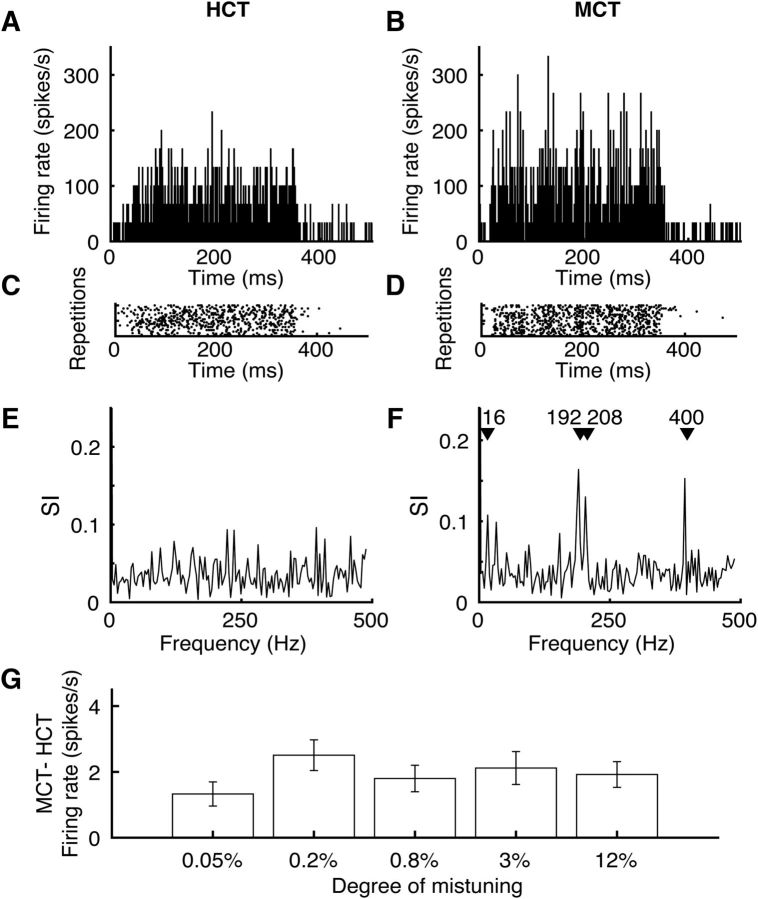
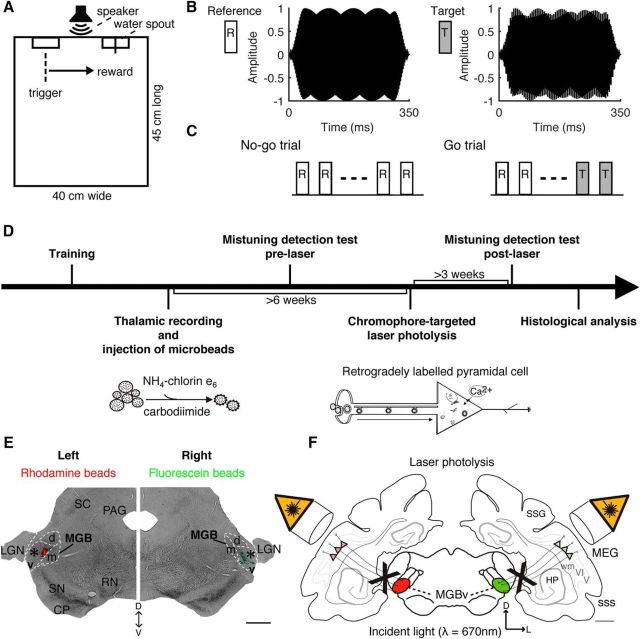
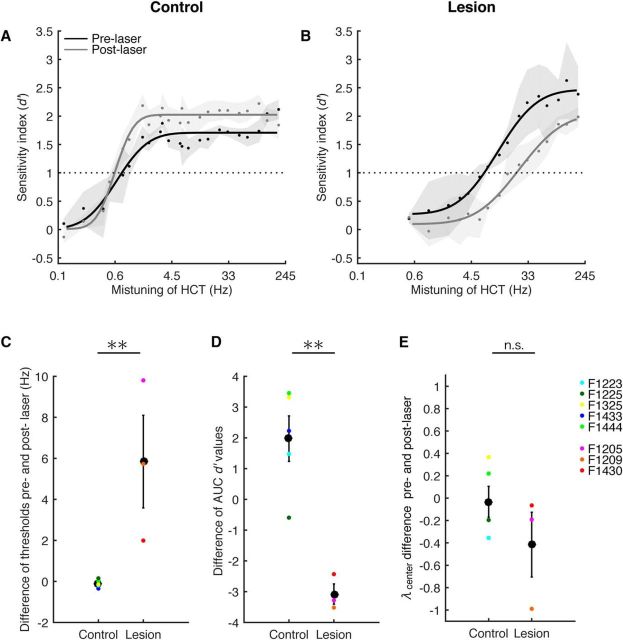
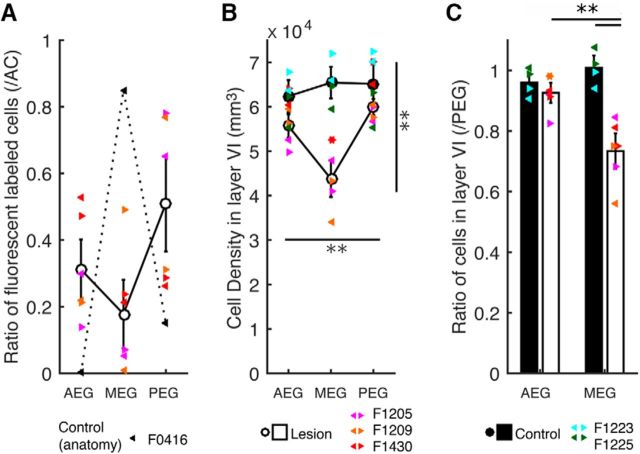
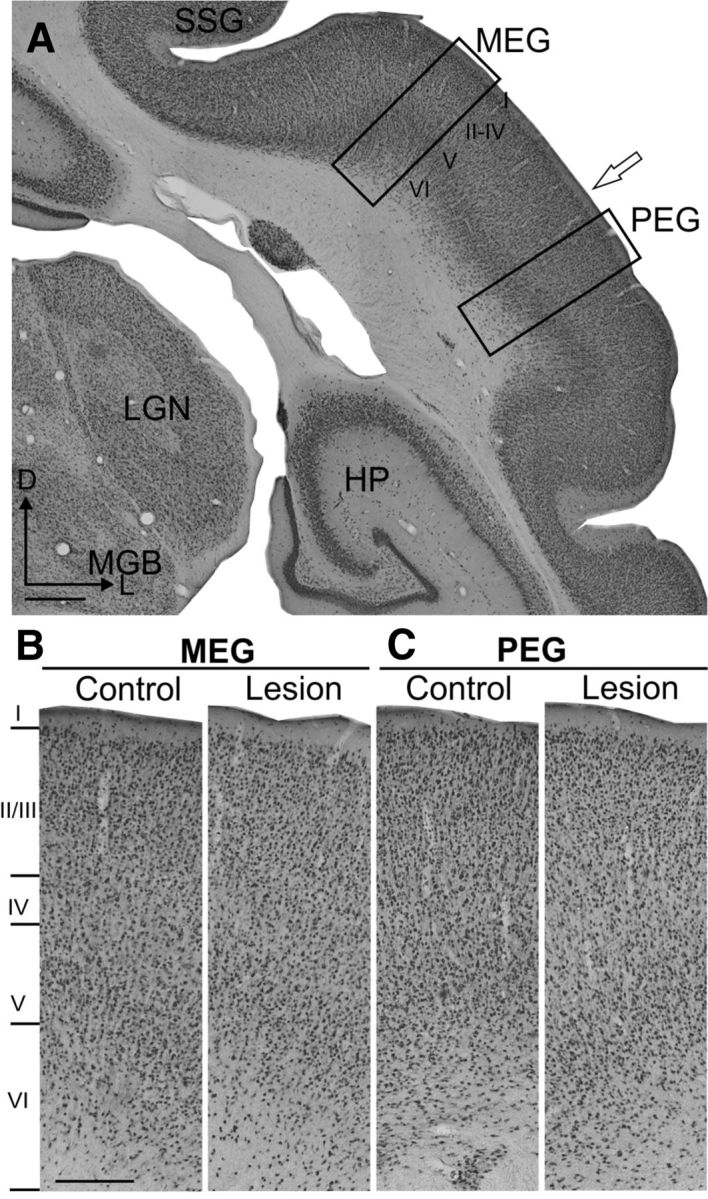
Feedback signals from the primary auditory cortex (A1) can shape the receptive field properties of neurons in the ventral division of the medial geniculate body (MGBv). However, the behavioral significance of corticothalamic modulation is unknown. The aim of this study was to elucidate the role of this descending pathway in the perception of complex sounds. We tested the ability of adult female ferrets to detect the presence of a mistuned harmonic in a complex tone using a positive conditioned go/no-go behavioral paradigm before and after the input from layer VI in A1 to MGBv was bilaterally and selectively eliminated using chromophore-targeted laser photolysis. MGBv neurons were identified by their short latencies and sharp tuning curves. They responded robustly to harmonic complex tones and exhibited an increase in firing rate and temporal pattern changes when one frequency component in the complex tone was mistuned. Injections of fluorescent microbeads conjugated with a light-sensitive chromophore were made in MGBv, and, following retrograde transport to the cortical cell bodies, apoptosis was induced by infrared laser illumination of A1. This resulted in a selective loss of ∼60% of layer VI A1-MGBv neurons. After the lesion, mistuning detection was impaired, as indicated by decreased d' values, a shift of the psychometric curves toward higher mistuning values, and increased thresholds, whereas discrimination performance was unaffected when level cues were also available. Our results suggest that A1-MGBv corticothalamic feedback contributes to the detection of harmonicity, one of the most important grouping cues in the perception of complex sounds.SIGNIFICANCE STATEMENT Perception of a complex auditory scene is based on the ability of the brain to group those sound components that belong to the same source and to segregate them from those belonging to different sources. Because two people talking simultaneously may differ in their voice pitch, perceiving the harmonic structure of sounds is very important for auditory scene analysis. Here we demonstrate mistuning sensitivity in the thalamus and that feedback from the primary auditory cortex is required for the normal ability of ferrets to detect a mistuned harmonic within a complex sound. These results provide novel insight into the function of descending sensory pathways in the brain and suggest that this corticothalamic circuit plays an important role in scene analysis.

Keywords: auditory cortex; behavior; chromophore-targeted laser photolysis; ferret; harmonic complex tones; medial geniculate body.


Figures

Figure 1.
Figure 1.
Identification of the ventral division of MGB. A, Schematic of the recording probe (NeuroNexus; 16 recording sites, 100 μm apart) placed dorsoventrally through the cortex into LGN and MGB. B, Coronal section of the midbrain indicating the location of the electrode tracks (arrow in the left MGBv and arrowhead in the right LGN). C, D, Examples of responses to stimulation with broadband noise (BBN) alone or combined with light flashes from an amber LED in the visual (C) and auditory (D) thalamus. The lines parallel to the y-axis indicate the light stimulus, and the triangular bars represent the BBN stimuli increasing in amplitude from 50 to 90 dB SPL in 10 dB steps (20 repetitions). The stimulus duration is indicated by the horizontal bar beneath each plot starting at time 0. E, Example of a sharply tuned V-shaped FRA of multiunit activity recorded in MGBv. The white line indicates the tuning curve. CF is depicted by the white dot, and the white dashed line indicates the bandwidth at 30 dB above threshold. The color scale represents the number of spikes evoked at each frequency-level combination during the 100 ms stimulus. F, Example PSTH of responses to pure tones at unit CF in MGBv. D, Dorsal; d, dorsal MGB; EG, ectosylvian gyrus; HP, hippocampus; L, lateral; LG, lateral gyrus; m, medial MGB; MEG, middle ectosylvian gyrus; PEG, posterior ectosylvian gyrus; SSG, suprasylvian gyrus; v, ventral MGB. Scale bars: A, B, 1 mm.
Figure 2.
Figure 2.
Responses to complex tones in MGBv. A, B, PSTHs showing the responses of one MGBv unit to 350 ms harmonic (A) and mistuned (B) complex tones. HCTs comprised 16 harmonics with a 400 Hz F0. In this example, for the MCT, the fourth harmonic was shifted by 192 Hz (12%). C, D, Raster plots corresponding to A and B, respectively. E, F, Temporal response patterns to HCTs (C) and MCTs (D) demonstrated using the SI. G, MCTs elicited higher firing rates than HCTs in MGBv units. Bars indicate the difference of firing rate from that evoked by the HCT (mean ± SEM) for each stimulus condition grouped by degree of mistuning (0.05%, 0.2%, 0.8%, 3% or 12%). Firing rate increased when MCTs were presented (repeated-measures ANOVA, F(5,290) = 7.4, p = 8.2 × 10⁻⁵), so long as the frequency of the mistuned harmonic fell within the FRA bandwidth of the unit at 30 dB above threshold.
Figure 3.
Figure 3.
Experimental design. A, The behavioral testing chamber contained two water spouts, labeled as trigger (left) and reward (right) spouts. In between, a loudspeaker was mounted at a height of 20 cm. B, Spectral envelopes of the reference HCT (F0, 400 Hz; 16 harmonics) and the target tone (MCT, 192 Hz shift in the fourth harmonic). Stimuli were 350 ms long and had a 25 ms Hanning ramp at the onset and offset. C, No-go trials comprised three to seven reference tones, whereas go trials comprised two to six reference tones followed by two target tones. D, After initial behavioral training, the lesion group received injections, guided by electrophysiological recordings, of fluorescent microbeads conjugated with chlorin e6 in the MGBv. Sham operations were performed in the controls. After measuring mistuning detection, A1 was exposed bilaterally to near-infrared laser light to induce apoptosis of corticothalamic projection neurons. Three weeks later, mistuning detection was tested again. Finally, brains underwent histological analysis to quantify the corticothalamic lesions. E, Coronal section of one animal at the level of the auditory thalamus, indicating the injection sites of rhodamine (red) and fluorescein (green) microbeads in the left and right MGBv, respectively (asterisks). F, Summary of experimental design for lesioning auditory corticothalamic neurons. V/VI, cortical layers V and VI; PAG, periaqueductal gray; RN, red nucleus; SC, superior colliculus; SN, substantia nigra; sss, suprasylvian sulcus; wm, white matter. Other abbreviations are as in Figure 1 legend. Scale bars, 1 mm.
Figure 4.
Figure 4.
Surgical procedures did not affect the ability of the animals to perform the go/no-go task. Proportion of correct trials when animals had to discriminate MCTs from HCTs with a level difference (<10 dB) between the reference and target tones during the initial training, after injection of microbeads but before laser treatment (Pre-laser), and following laser treatment (Post-laser). Bars represent mean values (±SEM). Colored dots represent individual animals. No difference in performance was found for either the lesion or control group (two-way ANOVA: groups, F(1,17) = 1.2, p = 0.3; time, F(2,17) = 0.5, p = 0.6; interaction, F(2,17) = 0.9, p = 0.4).
Figure 5.
Figure 5.
Corticothalamic lesions impaired mistuning detection performance. A, B, Mean d′ (±SEM) values derived from the hit and false alarm rates of the control (A; n = 5) and lesion (B; n = 3) groups are plotted against the degree of mistuning (on a log scale) of a single-frequency component of an HCT. For each group, data are shown before laser illumination (pre-laser period, black) and >3 weeks after (post-laser period, gray). A cumulative Gaussian distribution was used to fit the psychometric functions (lines). Dots represent mean values across animals, and the shaded areas represent the SEM. The horizontal dashed lines indicate the threshold criterion of d′ = 1. CE, Differences (mean ± SEM) between pre-laser and post-laser performance were computed for threshold (C), the AUC of the psychometric functions (D), and λcenter values (E). Colored dots represent data from individual animals. Significant differences between the control and lesion groups are indicated above the panels: **p < 0.01. n.s., Not significant.
Figure 6.
Figure 6.
Corticothalamic cell loss after chromophore-targeted laser photolysis in the A1-MGBv pathway. A, The ratio of labeled cells in MEG (where A1 is located), PEG and AEG relative to the total number of labeled cells in the ectosylvian gyrus. White circles indicate the mean in the lesion animals. Black triangles represent values obtained from an anatomical control case in which BDA was injected into the MGBv. Different colors represent individual animals. The left and right pointing triangles indicate data from the left and right hemispheres, respectively. B, Cell density values in layer VI of MEG, PEG, and AEG. Black circles represent the mean in control cases, while white circles indicate the mean in lesion cases. Cell density in the lesion group was significantly different between different auditory cortical regions and from that in the control group (repeated-measures ANOVA: regions, F(2,6) = 8.9, p = 0.016; region × group, F(2,6) = 11.4, p = 0.009). C, Histograms of cell density ratio in MEG and AEG (relative to PEG; mean ± SEM) showed significantly lower cell density in the MEG in the lesion group than in the control group (Tukey–Kramer test, **p < 0.01).
Figure 7.
Figure 7.
Neuronal density in layer VI of MEG is lower in animals with corticothalamic lesions than in controls. A, Coronal section immunostained with NeuN at the level of the auditory cortex (control case). Rectangles indicate the regions of MEG (where A1 is located) and PEG shown at higher magnification in B and C. The open arrow indicates the border between MEG and PEG. B, NeuN cell density in MEG layer VI of the lesion example is lower than in the control (for quantification, see Fig. 6). C, No difference in cell density in layer VI of the PEG was found between control and lesion cases. Scale bars: A, 1 mm; B, 250 μm. I–VI, layers 1–6 of the cortex.

Similar articles

Cited by

References

    1. Allon N, Yeshurun Y, Wollberg Z (1981) Responses of single cells in the medial geniculate body of awake squirrel monkeys. Exp Brain Res 41:222–232. - PubMed
    1. Anderson LA, Wallace MN, Palmer AR (2007) Identification of subdivisions in the medial geniculate body of the guinea pig. Hear Res 228:156–167. 10.1016/j.heares.2007.02.005 - DOI - PubMed
    1. Andolina IM, Jones HE, Wang W, Sillito AM (2007) Corticothalamic feedback enhances stimulus response precision in the visual system. Proc Natl Acad Sci U S A 104:1685–1690. 10.1073/pnas.0609318104 - DOI - PMC - PubMed
    1. Andolina IM, Jones HE, Sillito AM (2013) Effects of cortical feedback on the spatial properties of relay cells in the lateral geniculate nucleus. J Neurophysiol 109:889–899. 10.1152/jn.00194.2012 - DOI - PMC - PubMed
    1. Bajo VM, Rouiller EM, Welker E, Clarke S, Villa AE, de Ribaupierre Y, de Ribaupierre F (1995) Morphology and spatial distribution of corticothalamic terminals originating from the cat auditory cortex. Hear Res 83:161–174. 10.1016/0378-5955(94)00199-Z - DOI - PubMed

LinkOut - more resources