

The FTD-like syndrome causing TREM2 T66M mutation impairs microglia function, brain perfusion, and glucose metabolism
- PMID: 28559417
- PMCID: PMC5494459
- DOI: 10.15252/embj.201796516
The FTD-like syndrome causing TREM2 T66M mutation impairs microglia function, brain perfusion, and glucose metabolism
Abstract
Genetic variants in the triggering receptor expressed on myeloid cells 2 (TREM2) increase the risk for several neurodegenerative diseases including Alzheimer's disease and frontotemporal dementia (FTD). Homozygous TREM2 missense mutations, such as p.T66M, lead to the FTD-like syndrome, but how they cause pathology is unknown. Using CRISPR/Cas9 genome editing, we generated a knock-in mouse model for the disease-associated Trem2 p.T66M mutation. Consistent with a loss-of-function mutation, we observe an intracellular accumulation of immature mutant Trem2 and reduced generation of soluble Trem2 similar to patients with the homozygous p.T66M mutation. Trem2 p.T66M knock-in mice show delayed resolution of inflammation upon in vivo lipopolysaccharide stimulation and cultured macrophages display significantly reduced phagocytic activity. Immunohistochemistry together with in vivo TSPO small animal positron emission tomography (μPET) demonstrates an age-dependent reduction in microglial activity. Surprisingly, perfusion magnetic resonance imaging and FDG-μPET imaging reveal a significant reduction in cerebral blood flow and brain glucose metabolism. Thus, we demonstrate that a TREM2 loss-of-function mutation causes brain-wide metabolic alterations pointing toward a possible function of microglia in regulating brain glucose metabolism.
Keywords: TREM2; frontotemporal dementia; neurodegeneration; neuroinflammation; regulated intramembrane proteolysis.
© 2017 The Authors.
Figures
- A
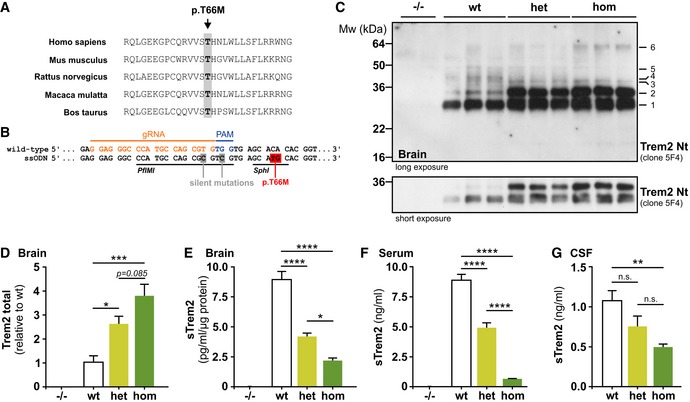
Alignment of five mammalian TREM2 protein sequences demonstrates complete sequence conservation at the positions harboring the disease‐associated p.T66M mutation.
- B
Strategy to target the murine Trem2 locus indicating the protospacer region (orange), protospacer adjacent region (PAM, blue), and the introduced nucleotide changes (gray or red). Restriction sites for PfIMI and SphI are underlined.
- C
Immunoblotting with anti‐Trem2 Nt (clone 5F4) of immunoprecipitated Trem2 from wild‐type (wt), heterozygous (het), and homozygous (hom) Trem2 p.T66M knock‐in mouse brain reveals a gene dose‐dependent accumulation of Trem2 (bands 1, 2, 3, and 6) accompanied by a reduction of higher molecular weight Trem2 species (bands 4 and 5). A shorter exposure is included to highlight the gene dose‐dependent accumulation of immature Trem2 (bands 1 and 2) in Trem2 p.T66M knock‐in mice. Note that bands can potentially arise from both Trem2 isoforms as well as from sTrem2 in the total lysate. Corresponding brain homogenates from Trem2 knockout (−/−) mice (Turnbull et al, 2006) were used to demonstrate specificity of immunoblotting signal.
- D
Quantification of total Trem2 immunoreactivity (bands 1–6 in C). Data from two experiments are shown as mean ± SEM; n wt = 7, n het = 8, n hom = 8. One‐way ANOVA, Tukey's post hoc test *P < 0.05; ***P < 0.001.
- E–G
Quantifications of sTrem2 from TBS‐soluble brain extracts (E), serum (F), and cerebrospinal fluid (CSF) (G) show a gene dose‐dependent reduction of sTrem2 in Trem2 p.T66M knock‐in mice. Importantly, the Trem2 ELISA was capable of detecting both wild‐type and mutant Trem2 proteins in membrane fractions of transiently transfected HEK293 cells (Appendix Fig S1). In (E) and (F), mice of different age groups (3–13 months; brain: n wt = 12, n het = 8, n hom = 12; serum: n wt = 36, n het = 22, n hom = 35) were pooled for sTrem2 analysis and samples from homozygous Trem2 knockout mice (−/−; n = 2; (Turnbull et al, 2006)) were used to demonstrate specificity of ELISA signal. (G) n wt = 5, n het = 5, n hom = 8. Data are shown as mean ± SEM. One‐way ANOVA, Tukey's post hoc test (E and F); Kruskal–Wallis, Dunn's post hoc test (G); n.s., P > 0.05; *, P < 0.05; **, P < 0.01; ***, P < 0.001; ****, P < 0.0001; n.s., nonsignificant.
- A
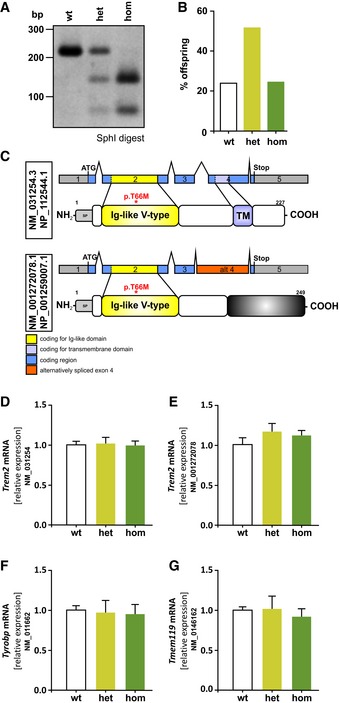
Representative of genotyping results using SphI restriction enzyme digest resulting in bands at 215 bp (lane 1: wild‐type; wt), 215 bp + 141 bp + 74 bp (lane 2: heterozygous; het), or 141 bp + 74 bp (lane 3: homozygous; hom).
- B
Mendelian pattern of inheritance in Trem2 knock‐in mice (n wt = 38, n het = 82, n hom = 39).
- C
Schematic overview of murine Trem2 transcripts and the respective proteins. Alternative splicing results in a transcript variant encoding soluble Trem2 (NM_001272078.1) lacking its transmembrane domain (NP_001259007.1).
- D–G
qRT–PCR analysis of the canonical (D) and alternative (E) Trem2 transcripts as well as the signaling adaptor Tyrobp (F) and a microglia marker Tmem119 (G) shows no significant changes due to introduction of the Trem2 p.T66M mutation in total brain of 6‐month‐old mice. Data are represented as mean ± SEM. n = 4 mice/genotype.
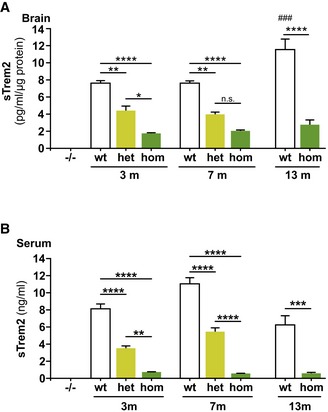
Brain samples used in Fig 1E split up in three different age groups according to mean age of the group. Data are represented as mean ± SEM (n = 4/genotype and group). One‐way ANOVA, Tukey's post hoc test; *P < 0.05; **P < 0.01; ****P < 0.0001; ### P < 0.001; # denotes significant differences between age groups within the wt group.
Serum samples used in Fig 1F split up in three different age groups according to mean age of the group. Data are represented as mean ± SEM (3 m: n wt = 20, n het = 8, n hom = 16; 6.5 m: n wt = 12, n het = 13, n hom = 15; 13 m: n wt = 4, n hom = 4). One‐way ANOVA, Tukey's post hoc test; **P < 0.01; ***P < 0.001; ****P < 0.0001.
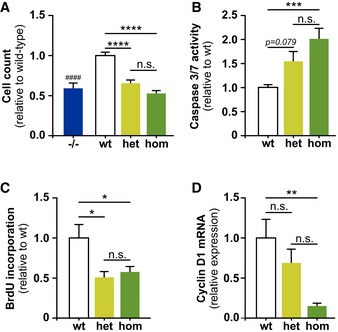
After 7 days of differentiation with M‐CSF both heterozygous (het) and homozygous (hom), BMDMs show a significantly reduced cell number similar to the reduction seen for Trem2 knockout (−/−) BMDMs (Turnbull et al, 2006). Data are shown as mean ± SEM from at least three independent experiments (n –/– = 9, n wt = 12, n het = 14, n hom = 12). One‐way ANOVA, Tukey's post hoc test; n.s., P > 0.05; ****, P < 0.001; n.s., nonsignificant; ####, P < 0.0001; # denotes significant differences between −/− and wt.
Caspase 3/7 activity measured using 5 × 10⁴ cells at day 7 of differentiation by a luminescence assay. Data are shown as mean ± SEM from two independent experiments (n wt = 7, n het = 8, n hom = 8). Kruskal–Wallis, Dunn's post hoc test; n.s., P > 0.05; ***, P < 0.001.
Bone marrow‐derived macrophages were differentiated in 12‐well plates for 6 days prior adding BrdU for the last 24 h of differentiation and BrdU incorporation was quantified by flow cytometry. Data are shown as mean ± SEM from two independent experiments (n = 5). One‐way ANOVA, Tukey's post hoc test; n.s., P > 0.05; *, P < 0.05.
qRT–PCR analysis of cyclin D1 (Ccnd1; NM_007631) in BMDMs shows significantly reduced cyclin D1 levels in homozygous Trem2 p.T66M BMDMs. Data are shown as mean ± SEM from two independent experiments (n = 5). One‐way ANOVA, Tukey's post hoc test; n.s., P > 0.05; **, P < 0.01.
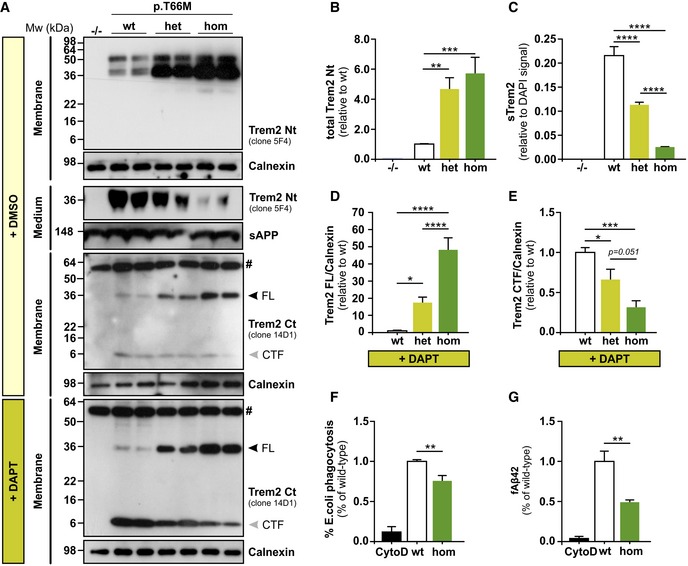
- A
Immunoblotting with anti‐Trem2 Nt (clone 5F4) and anti‐Trem2 Ct (clone 14D1) shows accumulation of mutant full‐length Trem2 in membrane fractions of heterozygous (het) and homozygous (hom) BMDMs compared to wild‐type (wt) BMDMs. BMDMs treated with DMSO show accumulation of mutant full‐length Trem2 in membrane fractions of heterozygous (het) and homozygous (hom) BMDMs compared to wild‐type (wt) BMDMs using anti‐Trem2 Ct (clone 14D1). Trem2 C‐terminal fragment (CTF) is generated in BMDMs derived from wt, heterozygous, and homozygous Trem2 p.T66M knock‐in mice, however to very moderate levels compared to DAPT‐treated BMDMs. Upon inhibition of γ‐secretase by DAPT treatment, wt BMDMs strongly accumulate a Trem2 CTF which is significantly reduced in an allele‐specific manner in Trem2 p.T66M knock‐in BMDMs. Analysis of conditioned media shows an allele‐specific reduction of sTrem2 in Trem2 p.T66M knock‐in BMDMs. Homozygous Trem2 knockout (−/−) BMDMs from a Trem2 knockout line (Turnbull et al, 2006) were used to confirm specificity of the Trem2 antibodies. Calnexin (membrane fractions) and sAPP (medium fractions) were used to confirm equal loading. FL, full‐length. # labels an unspecific band.
- B
Quantification of total Trem2 levels from immunoblots using the anti‐Trem2 Nt (clone 5F4) antibody. Data shown relative to wt as mean ± SEM. (n –/– = 3, n wt = 8, n het = 8, n hom = 8). One‐way ANOVA, Tukey's post hoc test; **, P < 0.01; ***, P < 0.001.
- C
Quantification of sTrem2 by ELISA in supernatants from mutant BMDMs confirms an allele‐specific reduction of sTrem2 in BMDMs derived from Trem2 p.T66M knock‐in mice. Levels of sTrem2 are depicted normalized to cell number as determined by quantification of DAPI signal. Data are represented as mean ± SEM (n wt = 12, n het = 16, n hom = 16). One‐way ANOVA, Tukey's post hoc test; ****, P < 0.0001.
- D, E
Quantification of Trem2 full‐length (D) and Trem2 CTF (E) levels upon treatment with DAPT using the anti‐Trem2 Ct (clone 14D1) antibody to detect Trem2. Trem2 levels were normalized to the signal of calnexin and data shown relative to wt as mean ± SEM from three independent experiments (n wt = 9, n het = 9, n hom = 7). One‐way ANOVA, Tukey's post hoc test; *P < 0.05; ***P < 0.001; ****P < 0.0001.
- F
Reduced phagocytosis of E. coli particles of BMDMs derived from homozygous Trem2 p.T66M knock‐in mice (hom) compared to wild‐type (wt). Data are represented relative to wt as mean ± SEM from three independent experiments (n CytoD = 4, n wt = 10, n hom = 9). One‐way ANOVA, Tukey's post hoc test; **P < 0.01.
- G
Phagocytosis of fAb42 by BMDMs from wild‐type (wt) and homozygous Trem2 p.T66M knock‐in mice (hom). Data are represented as relative to wt as mean ± SEM from three independent experiments (n CytoD = 3, n wt = 7, n hom = 8). One‐way ANOVA, Tukey's post hoc test; **P < 0.01.
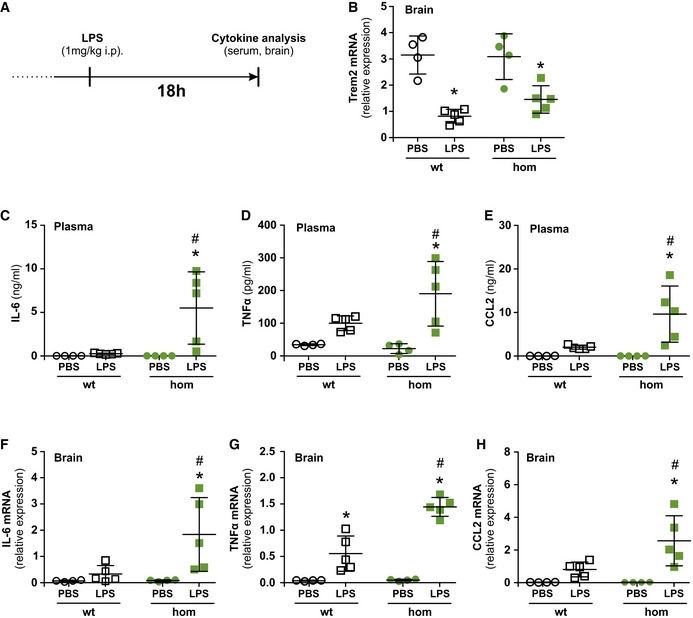
- A
Schematic representation of the experimental outline. i.p., intraperitoneal.
- B
Intraperitoneal injection of lipopolysaccharide (LPS) reduces Trem2 mRNA expression in the brain 18 h post‐injection in both wild‐type and homozygous Trem2 p.T66M knock‐in mice.
- C–E
Cytometric Bead Array‐based analysis of cytokine levels in the serum 18 h post‐injection with PBS or LPS shows significant increased levels of IL‐6 (C), TNF‐α (D), and CCL2 (E) in the serum of LPS‐injected Trem2 p.T66M knock‐in mice.
- F–H
qRT–PCR‐based analysis of cytokine levels in the brain 18 h post‐injection with PBS or LPS shows significant increased levels of IL‐6 (F), TNF‐α (G), and CCL2 (H) in the brain of LPS‐injected Trem2 p.T66M knock‐in mice.
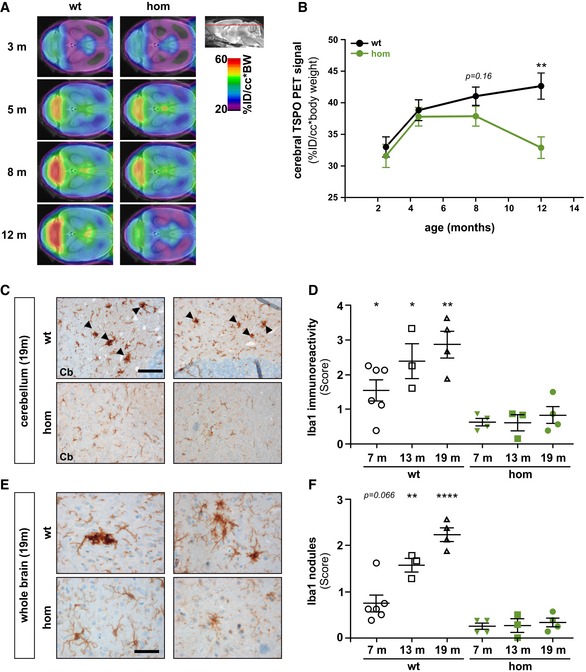
Axial slices of TSPO μPET imaging (scaled by %ID and body weight) are projected on a T1 MRI mouse template (left: cerebellum; right: frontal pole). Averaged images (n = 7–8 mice/genotype) show a clear visual decrease of TSPO activity in Trem2 p.T66M knock‐in mice aged 8 and 12 months when compared to wt.
Quantitative TSPO activity in wt (black) and hom (green) mice. Data are represented as mean ± SEM. n = 7–8 mice/genotype. Student's t‐test; **P < 0.01.
Iba‐1 immunohistochemistry in brains of 19‐month‐old wild‐type (wt) or homozygous Trem2 p.T66M knock‐in mice (hom) shows a strong signal with frequent occurrence of microglia nodule‐like structures (black arrowheads) in the cerebellar white matter of wt compared to mutant mice. Scale bar, 100 μm.
Semiquantitative analysis of Iba‐1 reactivity shows an age‐dependent increase in wt but not hom mice. Data are represented as mean ± SEM. n 6 m = 4–6 mice/genotype; n 13m = 3 mice/genotype; n 19m = 4 mice/genotype; Student's t‐test; *P < 0.05; **P < 0.01.
Iba1‐positive (Iba1+) nodules are also frequently observed throughout the brain in wt but not in hom mice. Scale bar, 50 μm.
Semiquantitative analysis of Iba1+ nodules shows an age‐dependent increase in wt but not hom mice. Data are represented as mean ± SEM. n 6m = 4–6 mice/genotype; n 13m = 3 mice/genotype; n 19m = 4 mice/genotype; Student's t‐test; **P < 0.01; ****P < 0.0001.
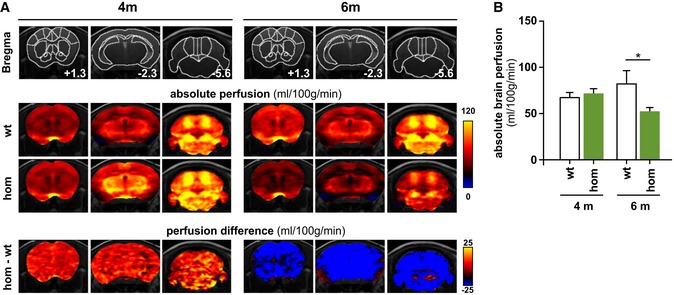
Upper panels: mouse brain atlas superimposed on T2‐weighted anatomical images with outlined regions of interest and indicated distance to bregma. Middle panels: color‐coded MRI images indicating mean absolute brain perfusion (according to the color bar on the right) of wild‐type (wt) and homozygous Trem2 p.T66M knock‐in (hom) mice depicted in three independent coronal slices at either 4 months (n wt = 12, n hom = 15) or 6 months (n wt = 8, n hom = 8) of age. Lower panels: color‐coded MRI images indicating the differences in brain perfusion between wt and hom mice (according to the color bar on the right).
Quantitative absolute brain perfusion showed no differences in 4‐month‐old Trem2 p.T66M knock‐in mice (n wt = 12, n hom = 15) while at 6 months of age absolute brain perfusion was significantly reduced in homozygous Trem2 p.T66M knock‐in mice compared to wild‐type controls (n wt = 8, n hom = 8). Data are represented as mean ± SEM. Two‐way mixed ANOVA; *P < 0.05.
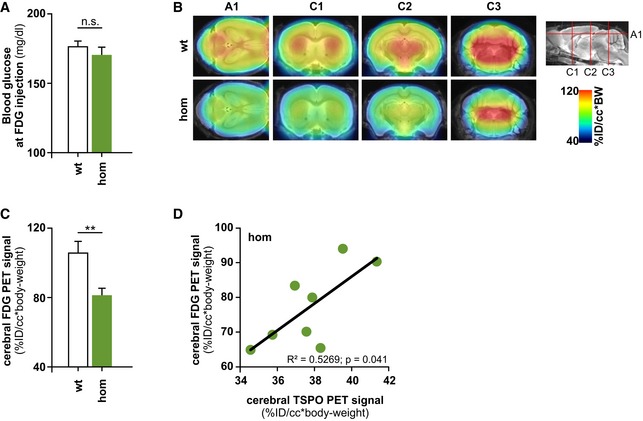
Analysis of blood glucose levels at the time point of FDG‐μPET analysis shows no significant differences between wild‐type (wt) and homozygous Trem2 p.T66M knock‐in mice (hom) (n wt = 6; n hom = 9 mice). Data are represented as mean ± SEM. Student's t‐test; n.s., P > 0.05.
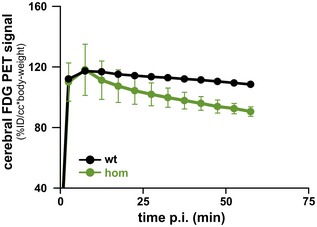
Axial (A1) and coronal (C1–3) slices of FDG μPET imaging (scaled by %ID and body weight) and normalized to blood glucose level are projected on a T1 MRI mouse template (left: cerebellum; right frontal pole). Averaged images (n wt = 6; n hom = 9 mice) show a clear visual decrease of FDG signal in several brain areas in Trem2 p.T66M knock‐in mice at 12 months of age when compared to age‐ and sex‐matched wt controls.
Quantitative FDG μPET signal in wt and hom mice. Data are represented as mean ± SEM. Student's t‐test; **P < 0.01 (n wt = 6; n hom = 9 mice).
Dual quantitative μPET shows a significant positive correlation of global cerebral FDG and TSPO signals in homozygous Trem2 p.T66M knock‐in mice (hom). Pearson product–moment correlation.
Comment in
-
Immunity at the forefront of the brain: A new genetic model of FTD.Sci Transl Med. 2017 Jun 14;9(394):eaan5227. doi: 10.1126/scitranslmed.aan5227. Sci Transl Med. 2017. PMID: 28615359
-
OH MYeloid! Immune cells wreaking havoc on brain homeostasis.EMBO J. 2017 Jul 3;36(13):1803-1805. doi: 10.15252/embj.201797465. Epub 2017 Jun 16. EMBO J. 2017. PMID: 28623242 Free PMC article.
References
-
- Borroni B, Ferrari F, Galimberti D, Nacmias B, Barone C, Bagnoli S, Fenoglio C, Piaceri I, Archetti S, Bonvicini C, Gennarelli M, Turla M, Scarpini E, Sorbi S, Padovani A (2014) Heterozygous TREM2 mutations in frontotemporal dementia. Neurobiol Aging 35: 934 e937–910 - PubMed
-
- Brendel M, Jaworska A, Herms J, Trambauer J, Rotzer C, Gildehaus FJ, Carlsen J, Cumming P, Bylund J, Luebbers T, Bartenstein P, Steiner H, Haass C, Baumann K, Rominger A (2015) Amyloid‐PET predicts inhibition of de novo plaque formation upon chronic gamma‐secretase modulator treatment. Mol Psychiatry 20: 1179–1187 - PMC - PubMed
Publication types
MeSH terms
Substances
Grants and funding
LinkOut - more resources
Full Text Sources
Other Literature Sources
Molecular Biology Databases
